Don't Ignore This Chart! March 30, 2012 at 06:43 AM
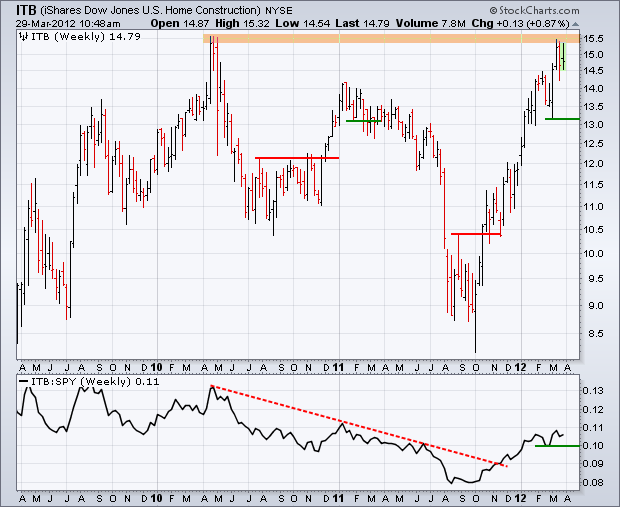
The Home Construction iShares (ITB) has been one of the best performing ETFs over the last six months, but this run may hit resistance from the 2010 highs in the 15.50 area. The six month trend is clearly up and I would mark support at the early March low... Read More
Don't Ignore This Chart! March 29, 2012 at 01:42 PM
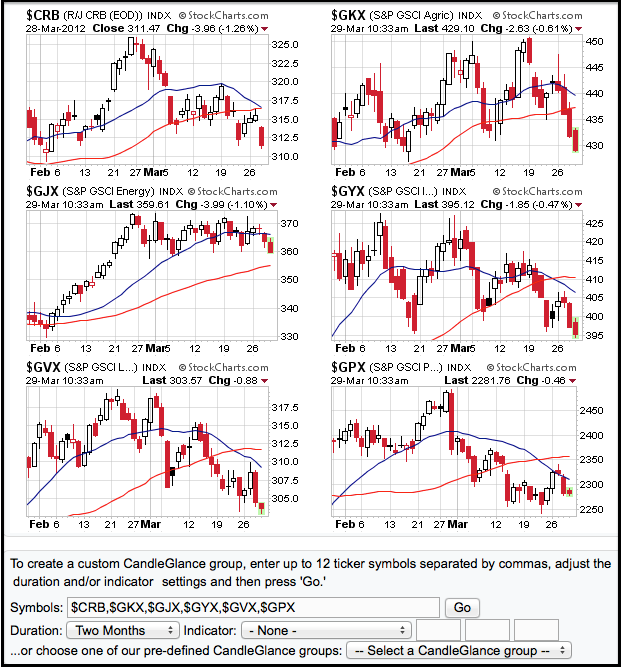
The six CandleGlance charts shows the CRB Index ($CRB) and five commodity groups. All are down today with the oil heavy CRB Index falling over 1%. The Industrial Metals Index (GJX) moved below its mid February low and the Agriculture Index ($GKX) fell over 4% the last nine days... Read More
Don't Ignore This Chart! March 27, 2012 at 01:32 PM
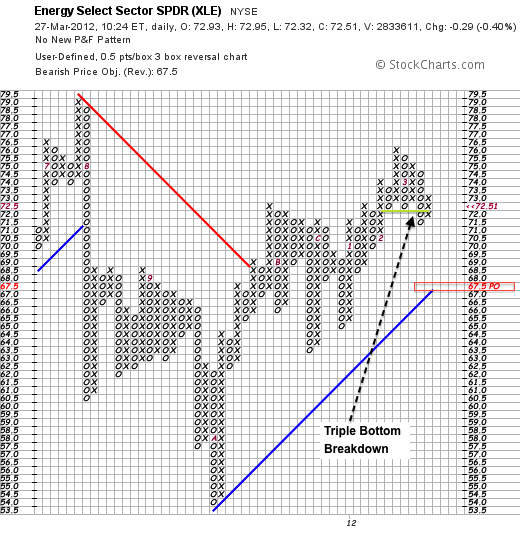
On the Point & Figure chart below, the Energy SPDR (XLE) forged a Triple Bottom Breakdown when the most recent O-Column moved below the equal lows of the prior two O-Columns. This breakdown is bearish with a downside projection around 67... Read More
Don't Ignore This Chart! March 26, 2012 at 03:03 PM
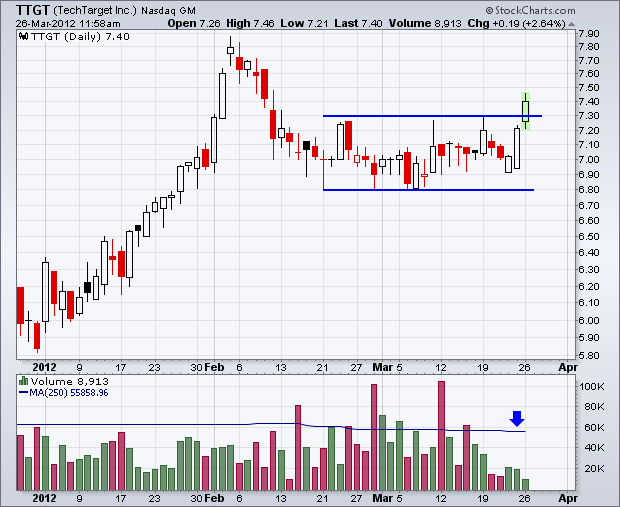
After consolidating since mid February, TechTarget (TTGT) finally made a break with a three-day surge above resistance. The move looks impressive price-wise, but volume is sorely lacking thus far... Read More
Don't Ignore This Chart! March 23, 2012 at 03:09 PM
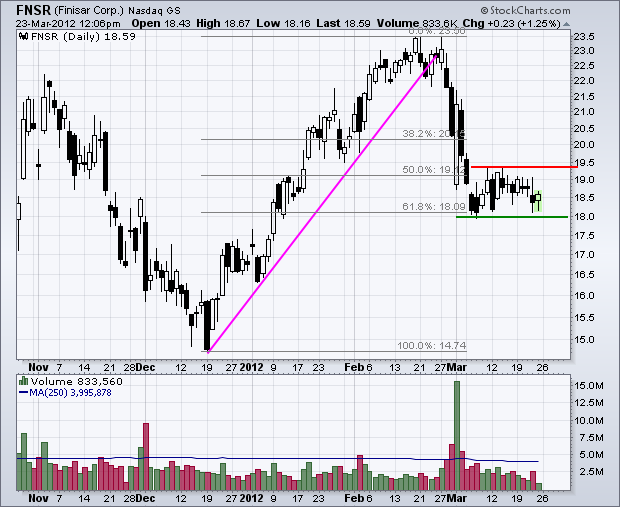
Finisar (FNSR) plunged with a move from 23.50 to 18, but found support right at the 61.80% retracement line, which is based on a Fibonacci number. Even though the stock has yet to recover, it is consolidating with clear support and resistance levels to watch going forward... Read More
Don't Ignore This Chart! March 22, 2012 at 09:06 PM
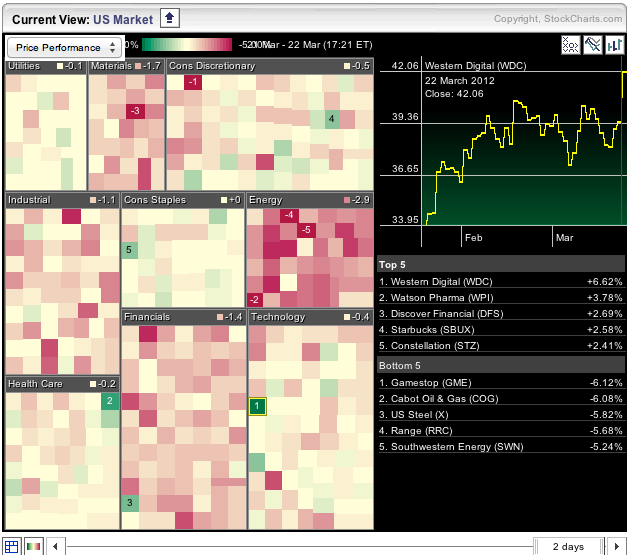
The Sector Market Carpet shows the nine S&P sectors with the energy sector displaying the most red. The average stock is down 2.9% and three of the five biggest losers come from this sector... Read More
Don't Ignore This Chart! March 21, 2012 at 02:27 PM
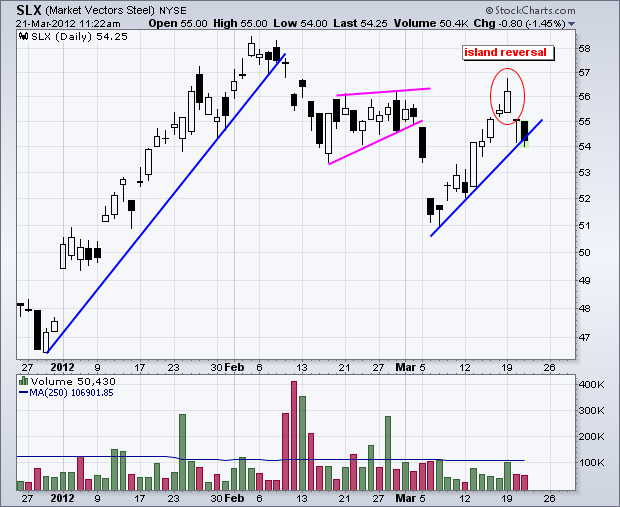
With a gap up, two candlesticks and a gap down, the Steel ETF (SLX) formed an island reversal over the last five days. Notice that this reversal formed near the late February highs and the ETF broke the March trendline with further weakness on Wednesday... Read More
Don't Ignore This Chart! March 20, 2012 at 08:55 PM
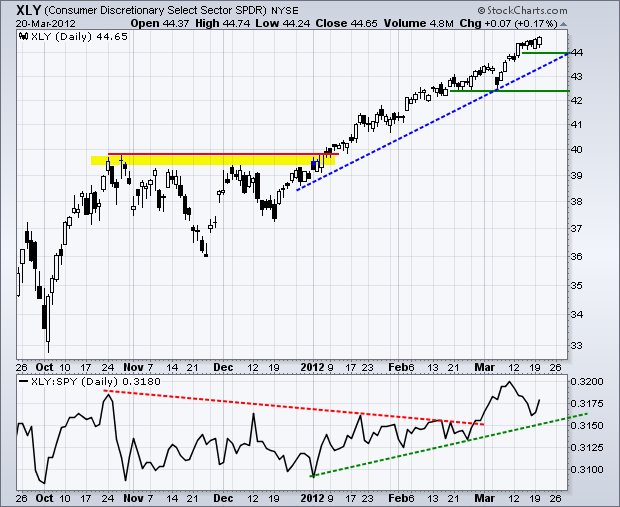
Want to gauge retail spending? Just take a look at the Consumer Discretionary SPDR (XLY), which hit a new 52-week high today. There are 80 stocks in this sector and most are dependant on consumer spending to drive revenues (think Disney, Macy's, Amazon, Starbucks, DR Horton)... Read More
Don't Ignore This Chart! March 19, 2012 at 06:39 PM
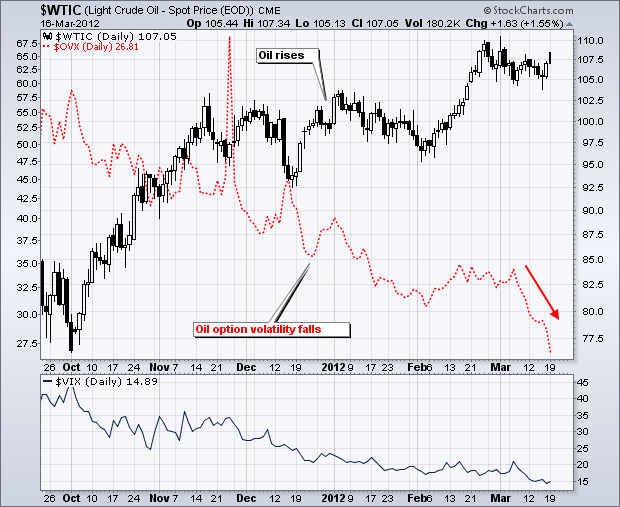
Volatility is falling everywhere these days. Notice that the CBOE Volatility Index ($VIX) and the Crude Oil Volatility Index ($OVX) both moved sharply lower in March. $OVX plunged the last two weeks as Spot Light Crude bounced off the 105 area for the second time this month... Read More
Don't Ignore This Chart! March 16, 2012 at 04:27 PM
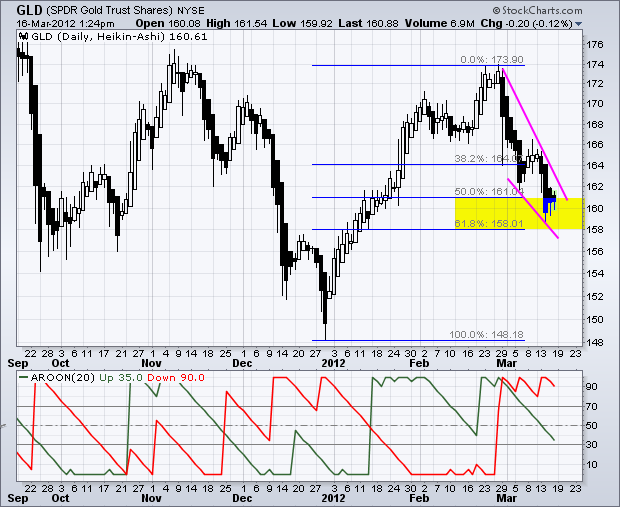
It has been a tough March for gold, but the Gold SPDR (GLD) may be at support marked by the Fibonacci Retracements Tool. Notice that the decline to 159 retraced 50-61.80% of the prior advance and the ETF firmed just above 160 the last two days... Read More
Don't Ignore This Chart! March 15, 2012 at 03:35 PM
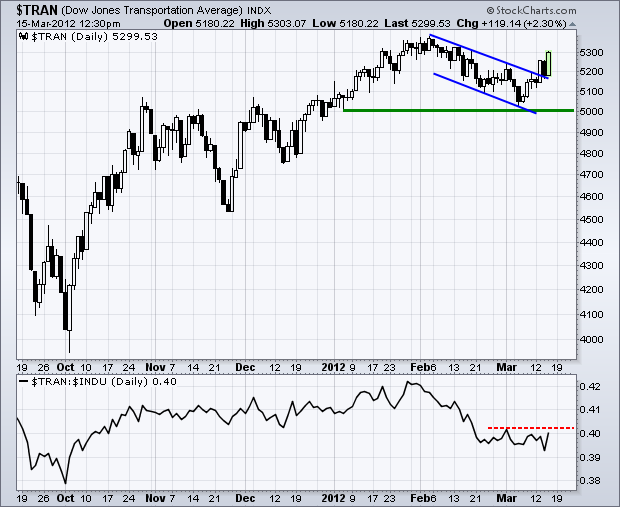
The Dow Transports has been lagging the Dow Industrials for several weeks now, but is making a catch up bid with a falling flag breakout the last few days. After a breakout on Monday, the Average fell back sharply on Tuesday with a close below 5200... Read More
Don't Ignore This Chart! March 14, 2012 at 08:16 PM
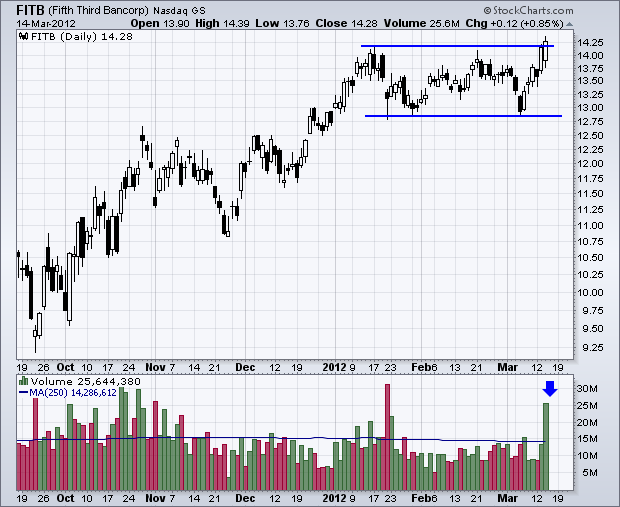
Looking for a list of market leaders? Simply go to the pre-defined scans page for a list of stocks hitting new 52-week highs. Over 500 stocks made the list on Tuesday and over 400 made the list today... Read More
Don't Ignore This Chart! March 13, 2012 at 04:07 PM
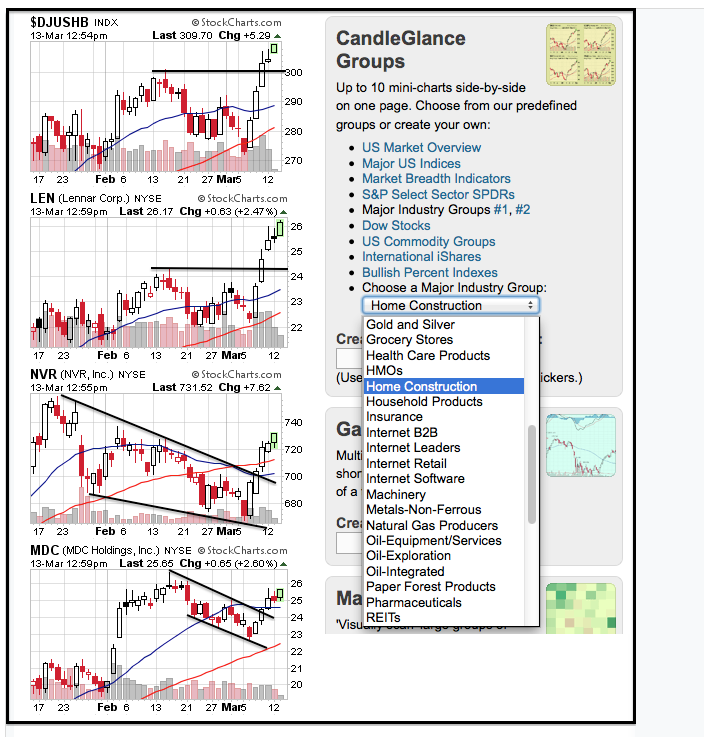
Chartists can access CandleGlance charts for dozens of industry groups on the FreeCharts page. The screen shot below shows some charts from the Home Construction industry group on the left and the industry group drop-down menu from the Free Charts page... Read More
Don't Ignore This Chart! March 12, 2012 at 06:45 PM
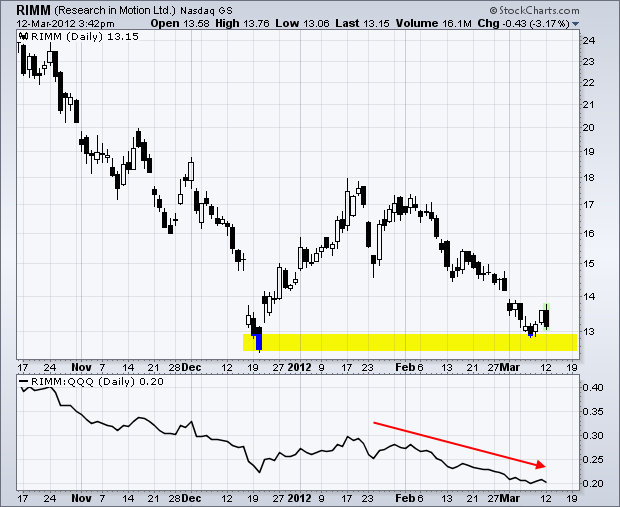
Research in Motion (RIMM) remains down in the dumps as the Price Relative broke below its December low and remains in a downtrend. This RIMM:QQQ ratio falls when RIMM underperforms QQQ... Read More
Don't Ignore This Chart! March 09, 2012 at 10:25 AM
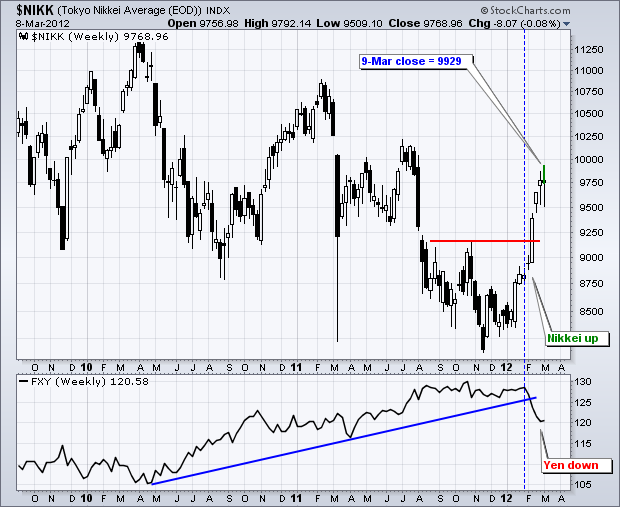
Lifted by exporters, the Nikkei 225 ($NIKK) is one of the best performing markets over the last eight weeks. The chart below shows the index surging from ±8400 to ±9900 since mid January (+17.8%)... Read More
Don't Ignore This Chart! March 08, 2012 at 07:04 PM
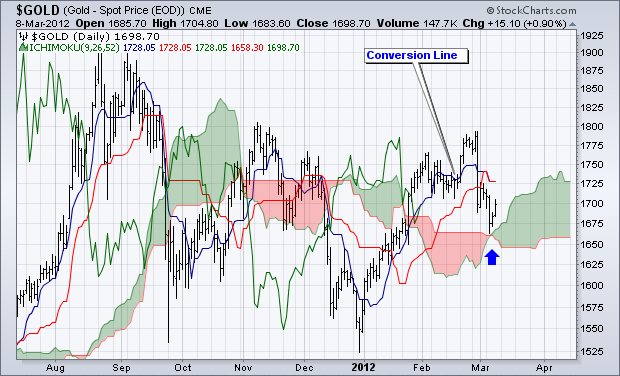
Spot Gold ($GOLD) declined sharply and then found support right at the Ichimoku Cloud with a bounce the last two days. The bulls grabbed the edge with the cloud breakout in January and hold the edge as long as cloud support holds... Read More
Don't Ignore This Chart! March 07, 2012 at 07:55 PM
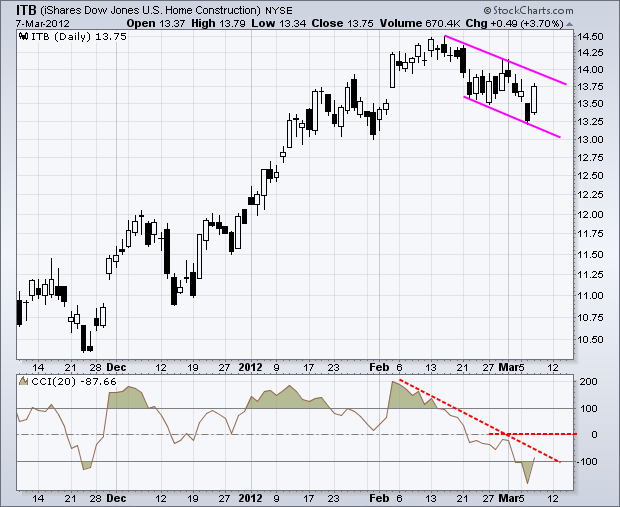
The Home Construction iShares (ITB) corrected over the last few weeks with a falling flag pattern taking shape. The flag is still falling, but the Commodity Channel Index is rebounding with a move back above -100 (oversold). The next step for CCI is a trendline break... Read More
Don't Ignore This Chart! March 06, 2012 at 01:59 PM
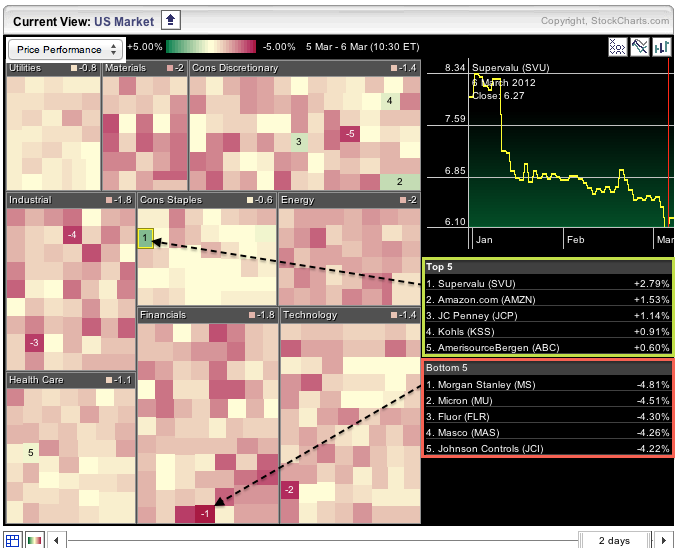
With stocks down sharply in early trading on Tuesday, it is little surprise that the Sector Market Carpet shows a sea of red and all sectors are lower. There are, however, a few gainers and three come from the consumer discretionary sector, strangely enough... Read More
Don't Ignore This Chart! March 05, 2012 at 06:33 PM
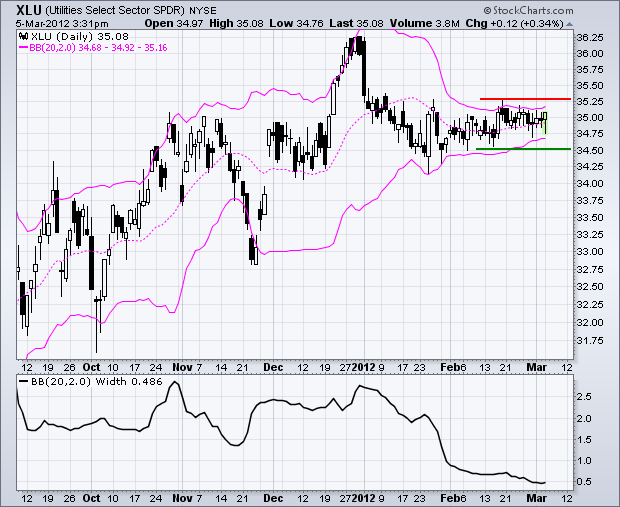
With the volatility contracting over the last few weeks, the Bollinger Bands on the Utilities SPDR (XLU) are at their narrowest since March 2011. The Bollinger BandWdith indicator is below .50 and the XLU range has narrowed to 75 cents... Read More
Don't Ignore This Chart! March 02, 2012 at 11:49 AM
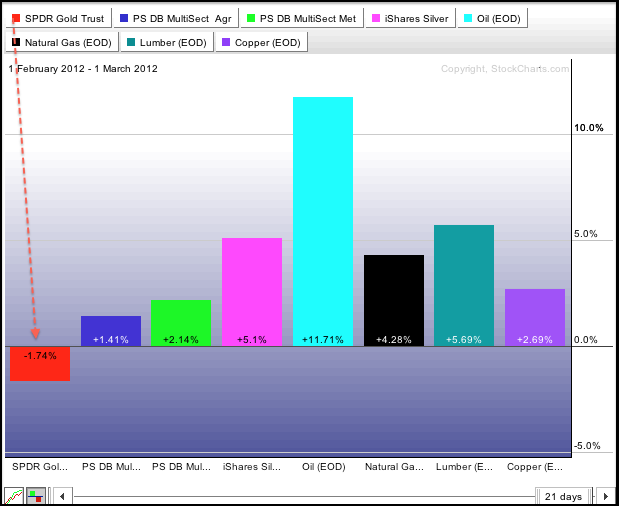
The PerfChart below shows the performance for eight commodity related securities during February. Seven of eight are up with oil leading the charge. Even natural gas was higher. After a big hit on Wednesday, gold is the laggard and the Gold SPDR (GLD) shows a modest loss... Read More
Don't Ignore This Chart! March 01, 2012 at 04:36 PM
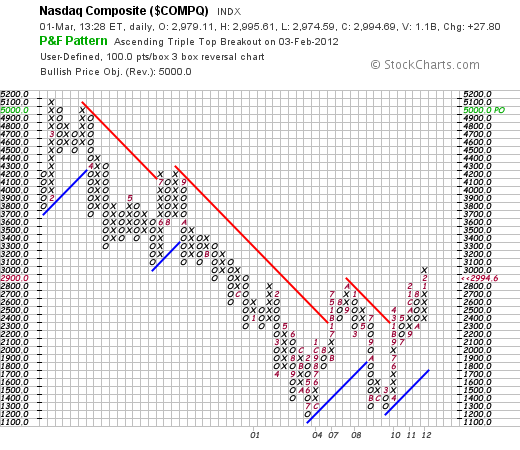
The Point & Figure chart below shows the Nasdaq forming two lows in the 1200 area and then breaking above its intermittent high this year. It looks like a massive Double Bottom with an upside price target around 5000... Read More