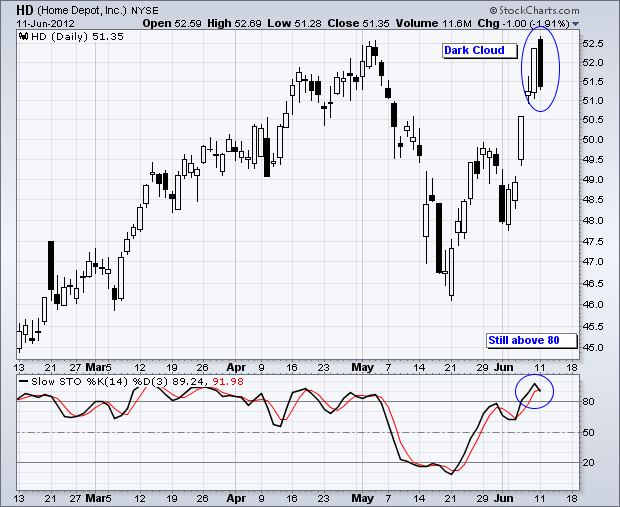
With a strong open and weak close on Monday, hundreds of stocks and ETFs formed either dark cloud patterns or bearish engulfing patterns. The chart below shows Home Depot (HD) forming a dark cloud near resistance and with the Stochastic Oscillator overbought. A move below 80 in the Stochastic Oscillator would signal a downturn in momentum. You can read more about candlestick patterns in the ChartSchool or see more scan results on the predefined scan page.
Click this image for a live version.

About the author:
Arthur Hill, CMT, is the Chief Technical Strategist at TrendInvestorPro.com. Focusing predominantly on US equities and ETFs, his systematic approach of identifying trend, finding signals within the trend, and setting key price levels has made him an esteemed market technician. Arthur has written articles for numerous financial publications including Barrons and Stocks & Commodities Magazine. In addition to his Chartered Market Technician (CMT) designation, he holds an MBA from the Cass Business School at City University in London.
Learn More


