Don't Ignore This Chart! July 31, 2012 at 04:56 PM
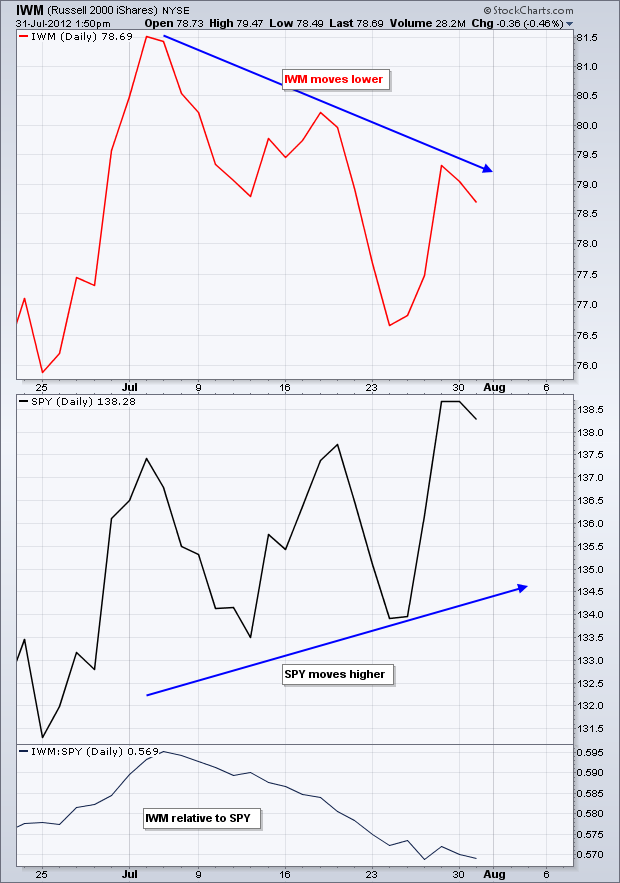
The Russell 2000 ETF (IWM) and the S&P 500 ETF (SPY) parted ways over the last few weeks. IWM peaked in early July and zigzagged lower. SPY, in contrast, zigzagged higher with a move above the mid July high. This divergence means small-caps are showing relative weakness... Read More
Don't Ignore This Chart! July 30, 2012 at 05:45 PM
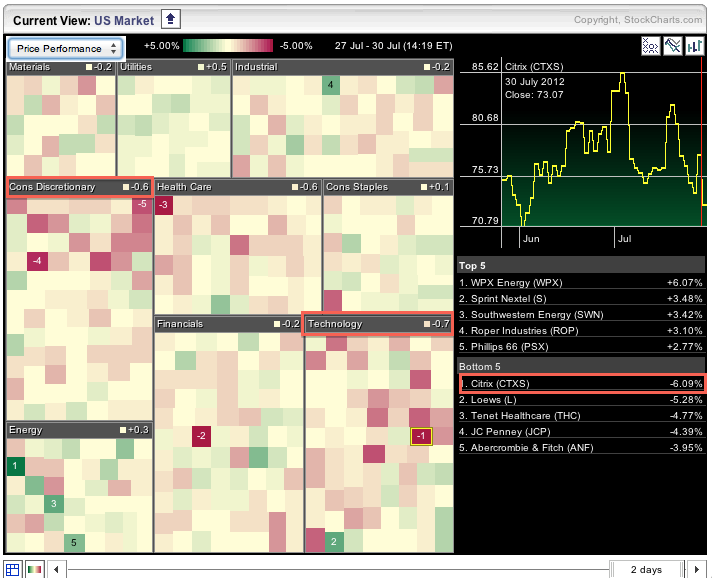
Stocks were weak on Monday with the Technology Sector (XLK) leading the market down. The average loss for a technology stock was .70 percent. Citrix (CTXS) was the big loser with a decline of 6.09%. The Consumer Discretionary SPDR (XLY) was also showing weakness... Read More
Don't Ignore This Chart! July 26, 2012 at 02:07 PM
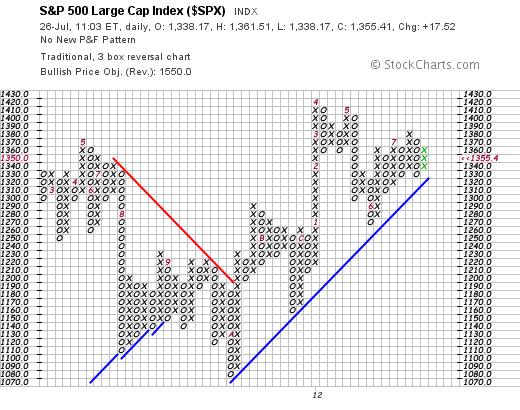
With a big surge above 1350 today, the S&P 500 reversed its falling O-Column and started a rising X-Column on the P&F chart. This reversal creates support from the prior two O-Columns and the rising Bullish Support Line (blue)... Read More
Don't Ignore This Chart! July 25, 2012 at 01:55 PM
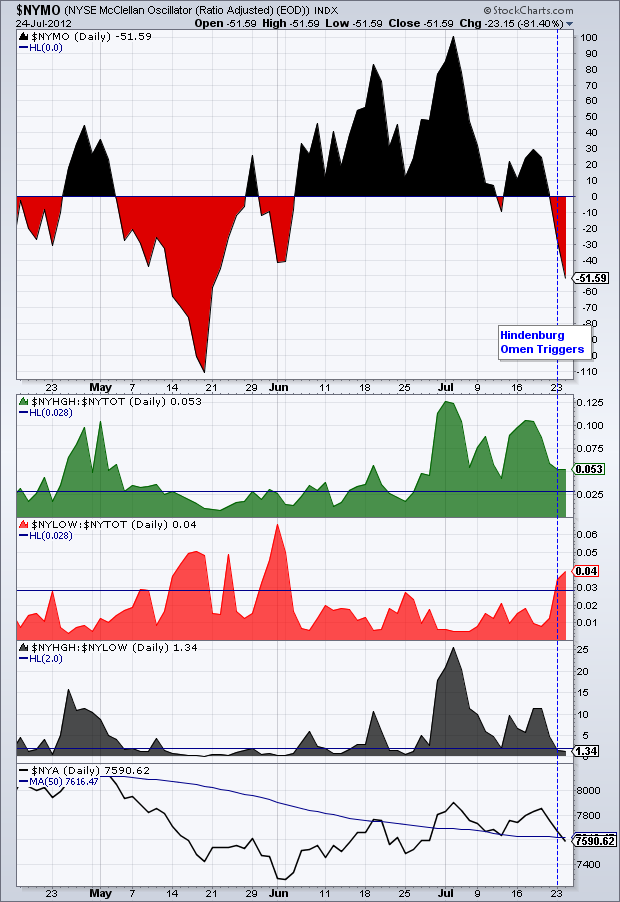
This blog entry has been updated to reflect new information. The Hindenburg omen almost triggered on July 23rd. First, notice that new highs and news lows as a percentage of total issues surged above 2.8%. Second, notice that new highs were less twice the number of new lows... Read More
Don't Ignore This Chart! July 24, 2012 at 05:20 PM
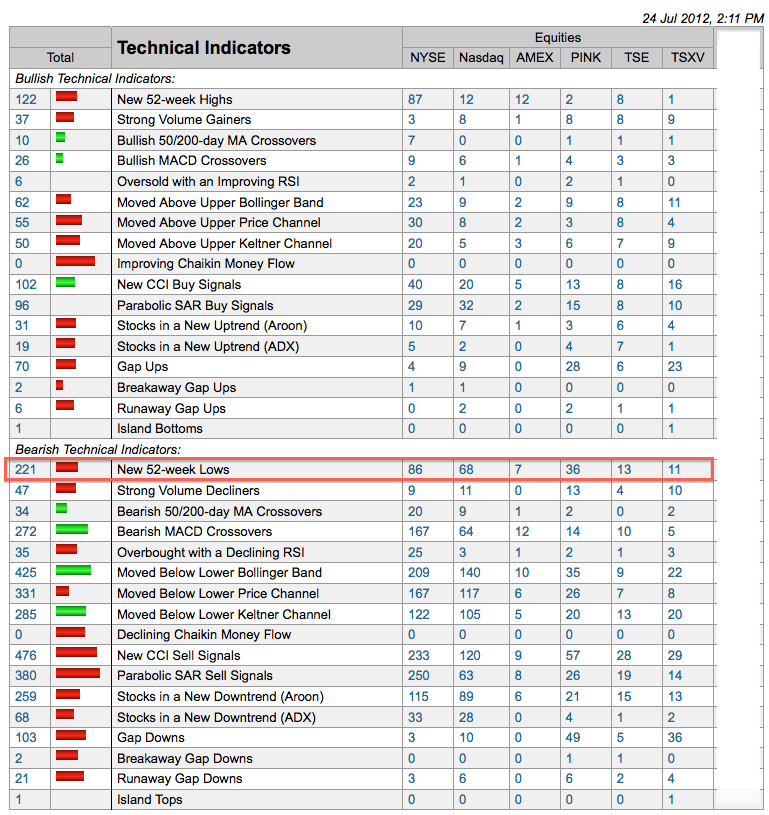
The image below comes from the predefined scans page. New highs were outpacking new lows earlier this month, but the tide is shifting as new lows expand on the NYSE and Nasdaq... Read More
Don't Ignore This Chart! July 23, 2012 at 06:00 PM
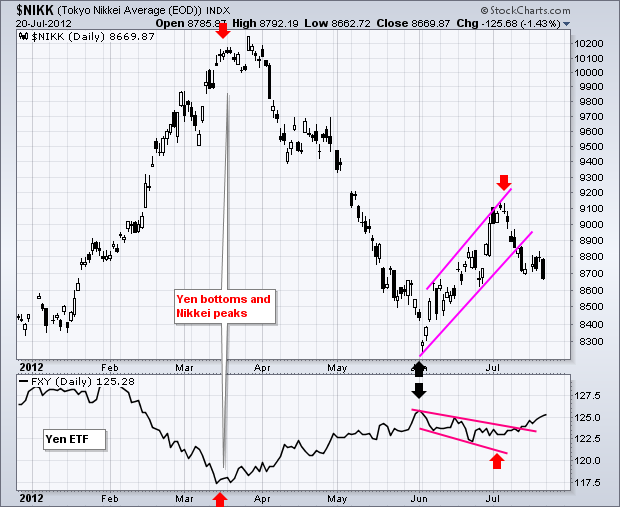
With the market shifting to risk-off mode the last few days, the Yen ETF (FXY) broke above trend line resistance. The Yen has been moving higher since early July and the Nikkei 225 ($NIKK) has been moving lower... Read More
Don't Ignore This Chart! July 20, 2012 at 10:48 AM
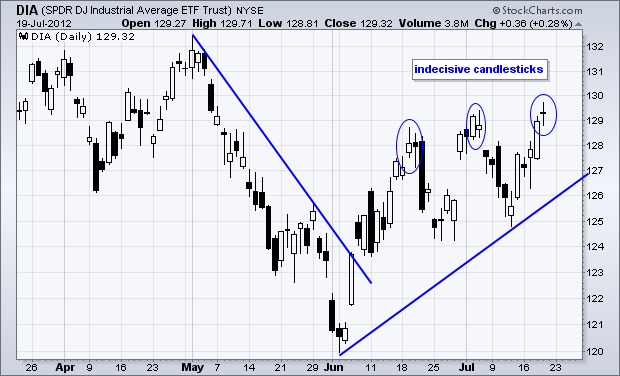
After a four day surge that carried the Dow Industrials SPDR (DIA) above 129, the ETF formed a doji to signal indecision on Thursday. Also notice that DIA formed indecisive candlesticks at the prior two peaks... Read More
Don't Ignore This Chart! July 19, 2012 at 06:47 PM
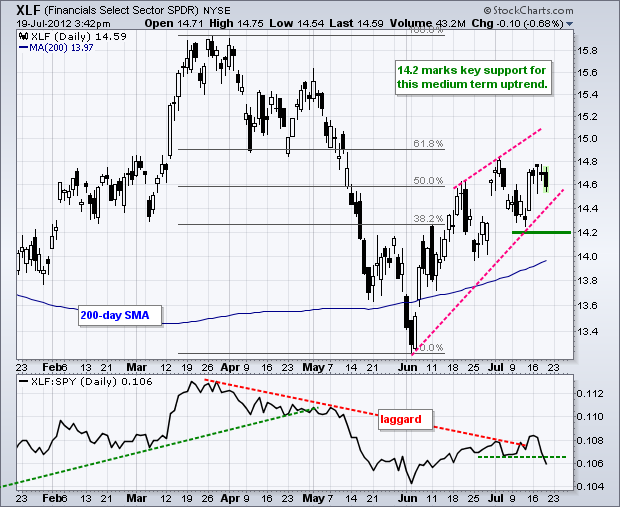
The Finance SPDR (XLF) led the market higher from early June to mid July, but stalled the last four days and started showing relative weakness. The indicator window shows the price relative (XLF:SPY ratio)... Read More
Don't Ignore This Chart! July 18, 2012 at 08:24 PM
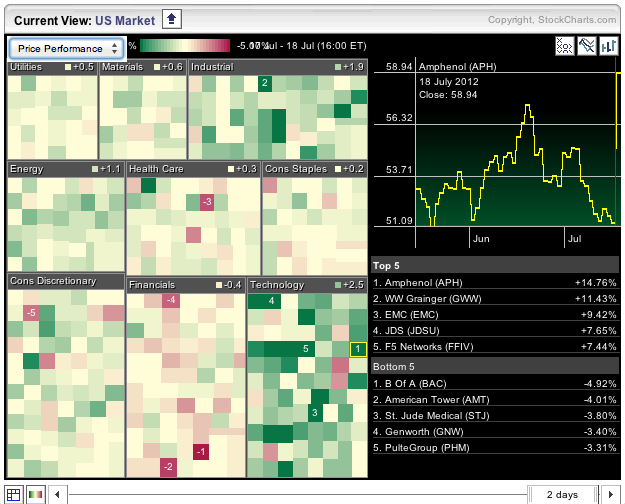
Stocks moved higher with the technology sector leading the charge on Wednesday. The Sector Carpet shows lots of green in this key sector. Also notice that four of the top five performers come from technology... Read More
Don't Ignore This Chart! July 16, 2012 at 07:17 PM
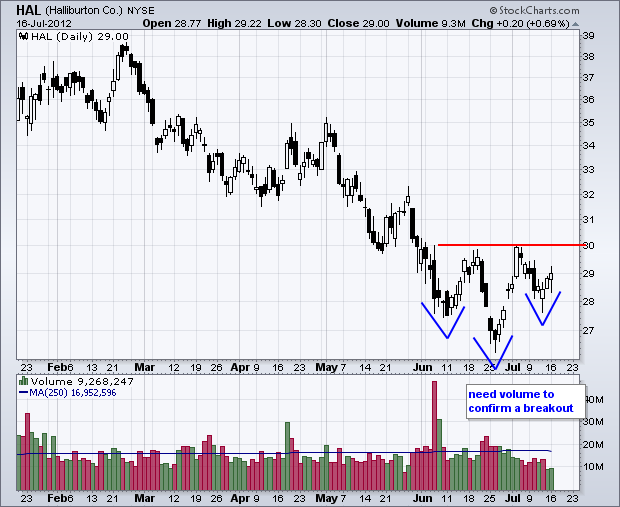
With oil bouncing over the last few weeks, Halliburton is tracing out a little head-and-shoulders bottom. Despite a potentially bullish pattern, the stock remains short of the breakout needed to confirm a reversal... Read More
Don't Ignore This Chart! July 13, 2012 at 10:38 AM
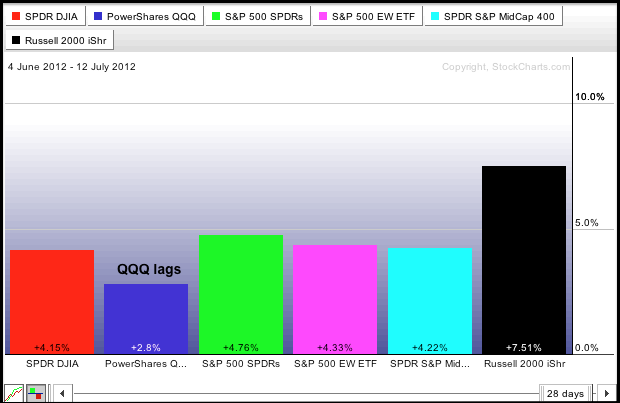
The stock market bottomed on June 4th and moved higher the last 5-6 weeks. All major index ETFs are up since June 4th, but the Nasdaq 100 ETF (QQQ) sports the smallest gain. The PerfChart below shows QQQ up 2.8% and the rest up 4% or more. Note that IWM is up a whopping 7... Read More
Don't Ignore This Chart! July 12, 2012 at 08:06 PM
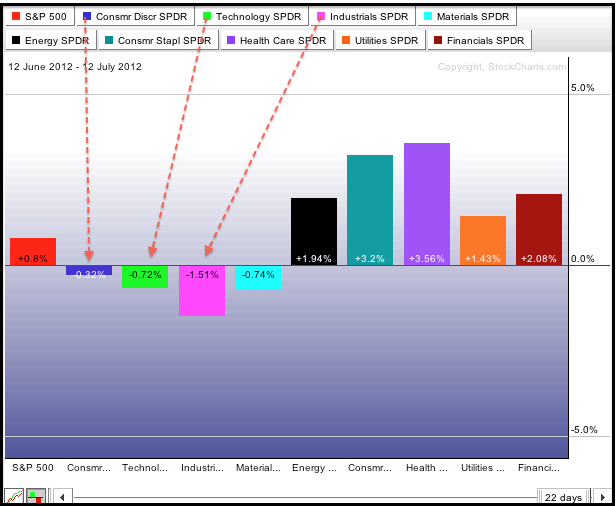
The Sector PerfChart shows the percentage change for the S&P 500 and the nine sector SPDRs over the past month (22 trading days). Note that the S&P 500 is up, but the Consumer Discretionary SPDR (XLY), Technology SPDR (XLK) and Industrials SPDR (XLI) are down... Read More
Don't Ignore This Chart! July 11, 2012 at 04:03 PM
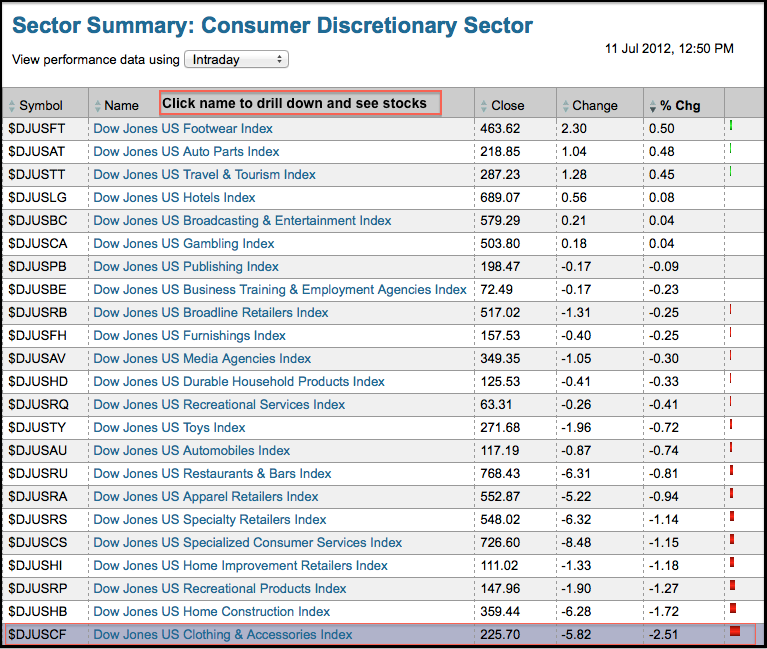
The Consumer Discretionary SPDR (XLY) is one of the weakest sectors on Wednesday. Drilling down into the sector reveals weakness in apparel stocks. True Religion (TRLG) is down over 5%, while Polo Ralph Lauren (RL) and Warnaco (WRC) are down around 4%... Read More
Don't Ignore This Chart! July 10, 2012 at 07:14 PM
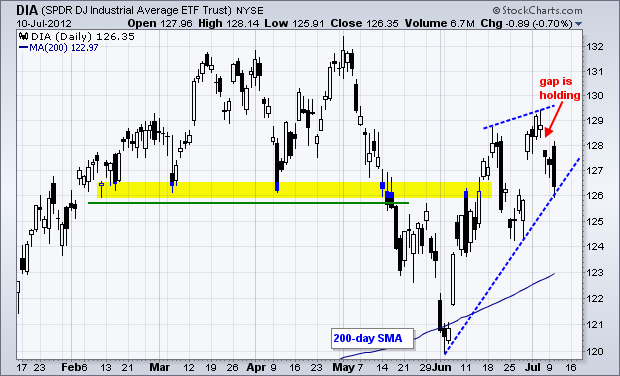
The Dow Industrials SPDR (DIA) formed a harami last week and then gapped down on Friday. This gap below 128 held as the ETF opened near 128 and then closed below 127 on Tuesday. Short-term, the bulls need to fill this gap... Read More
Don't Ignore This Chart! July 06, 2012 at 03:09 PM
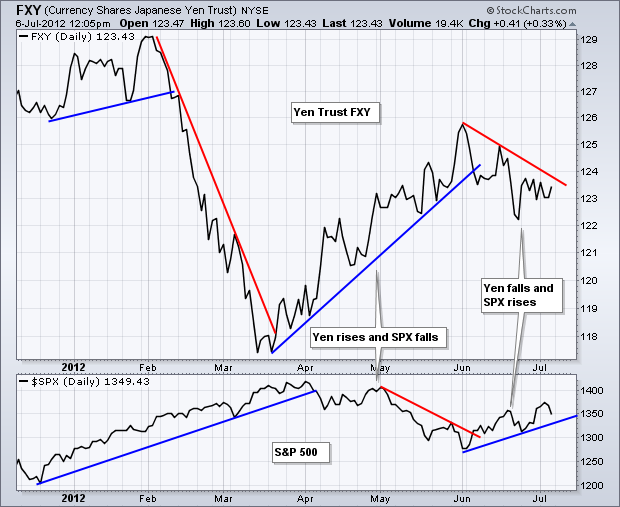
The Yen ETF (FXY) and the S&P 500 have been moving opposite each other for the last 6-7 months. This is because the Yen represents a safe-haven (risk-off) and the S&P 500 represents a risky asset (risk on). Accordingly, FXY broke down in June and $SPX moved higher... Read More
Don't Ignore This Chart! July 05, 2012 at 04:20 PM
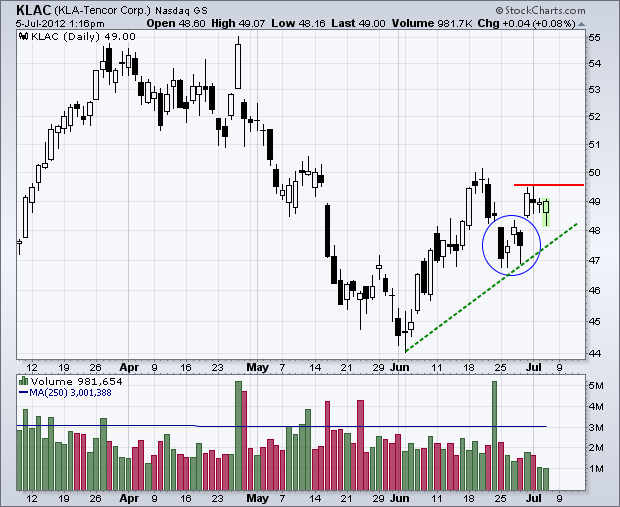
KLA-Tencor (KLA) has an island reversal of sorts working the last three weeks. Notice how the stock gapped down in mid June and then back up in late June. Since gapping higher last week, the stock consolidated the last four days... Read More
Don't Ignore This Chart! July 04, 2012 at 05:26 AM
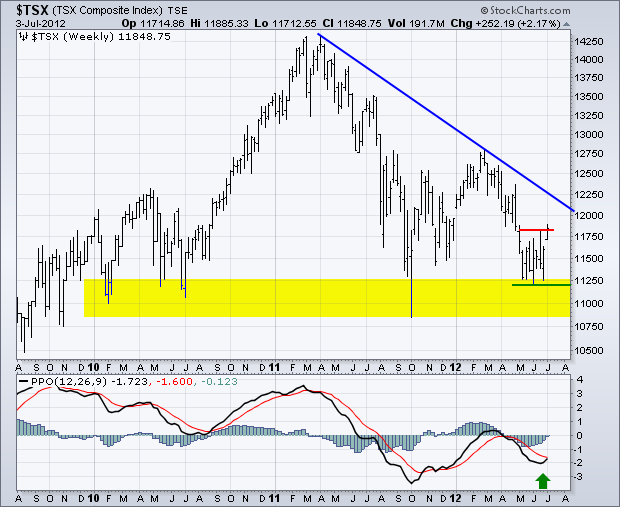
The big trend is down since early 2011 and a big head-and-shoulders could be forming, but, for now, the TSX Composite is showing life with a surge off support that extends all the way back to early 2010... Read More
Don't Ignore This Chart! July 03, 2012 at 10:31 AM
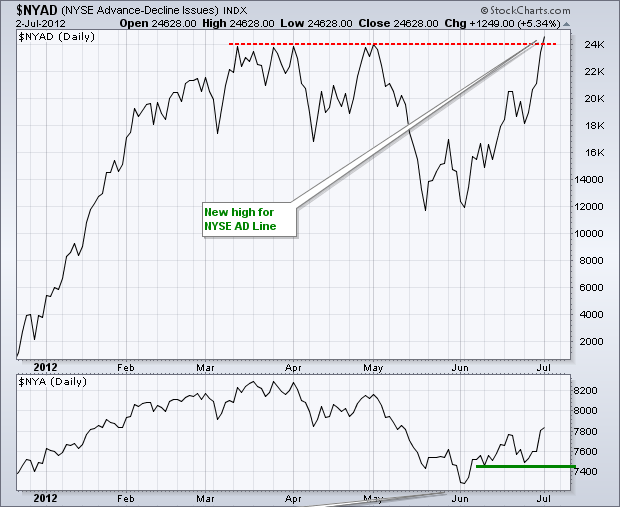
Even though the NY Composite ($NYA) remains below its prior highs, the NYSE AD Line hit a new high this week and shows underlying strength. Advance-decline numbers measure the internal strength or weakness within an index... Read More