Don't Ignore This Chart! March 29, 2013 at 04:47 AM
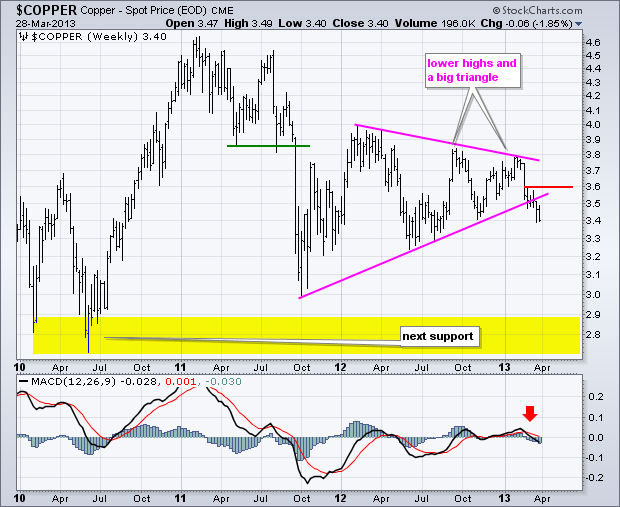
It has been a bearish year for Spot Copper ($COPPER) and the recent breakdown points to even lower prices ahead. In addition to MACD turning negative, copper broke triangle support to signal a continuation of the prior decline (2011). The next support zone resides in the 2... Read More
Don't Ignore This Chart! March 28, 2013 at 04:28 PM
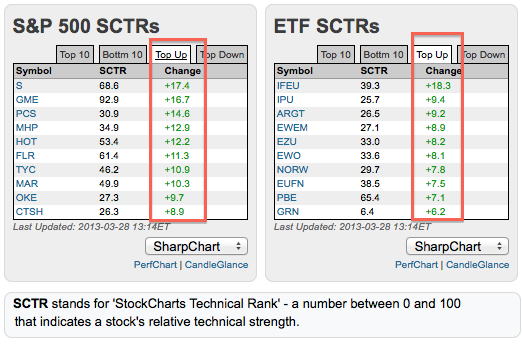
Sprint (S), Gamestop (GMS) and MetroPCS (PCS) are the big technical movers with double digit gains in the StockCharts Technical Rank (SCTR). All three recently broke above resistance on the price charts as well... Read More
Don't Ignore This Chart! March 27, 2013 at 07:16 PM
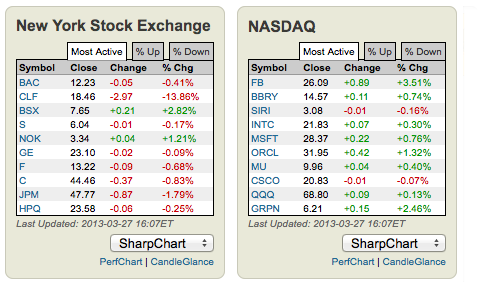
It was a rough day for the most active NYSE stocks as eight of ten moved lower. The opposite was true for the Nasdaq as eight moved higher. Old school titans Microsoft (MSFT) and Intel (INTC) joined newbies Facebook (FB) and Groupon (GRPN)... Read More
Don't Ignore This Chart! March 26, 2013 at 07:54 PM
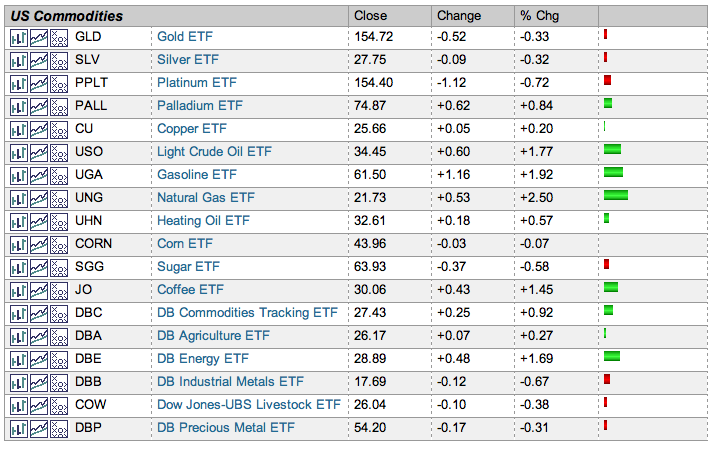
Oil was strong on Tuesday with the US Oil Fund (USO) gaining over 1.5%. Combined with gains in the US Natural Gas Fund (UNG), tbe US Gasoline Fund (UGA) and Heating Oil (UHN), the energy complex is showing strength across the board... Read More
Don't Ignore This Chart! March 25, 2013 at 07:04 PM
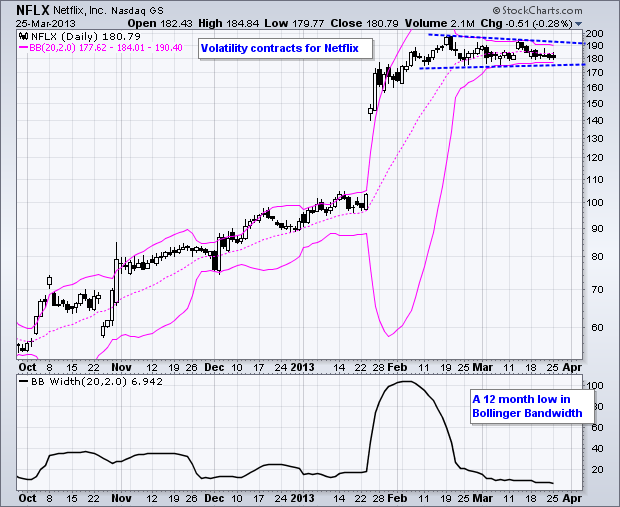
The noose is tightening as indecision reigns supreme for Netflix. After more than doubling, the stock moved into a tight range the last two months. Notice that BandWidth is below 7% as the Bollinger Bands narrow. The range break will deliver the next signal... Read More
Don't Ignore This Chart! March 22, 2013 at 04:06 PM
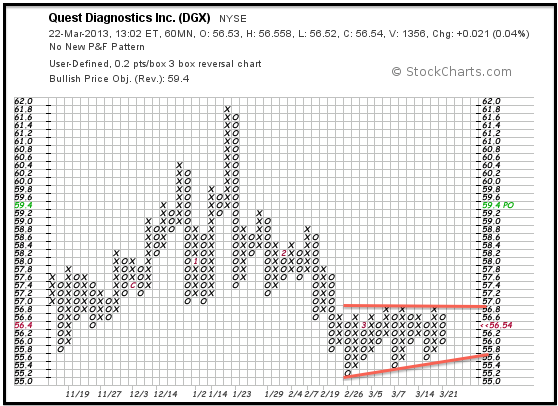
DGX moved sharply lower in January and February, but found support in late February and started a consolidation. The resolution of this consolidation will provide the next directional blue. A upside breakout would be bullish, while a downside break bearish... Read More
Don't Ignore This Chart! March 21, 2013 at 08:03 PM
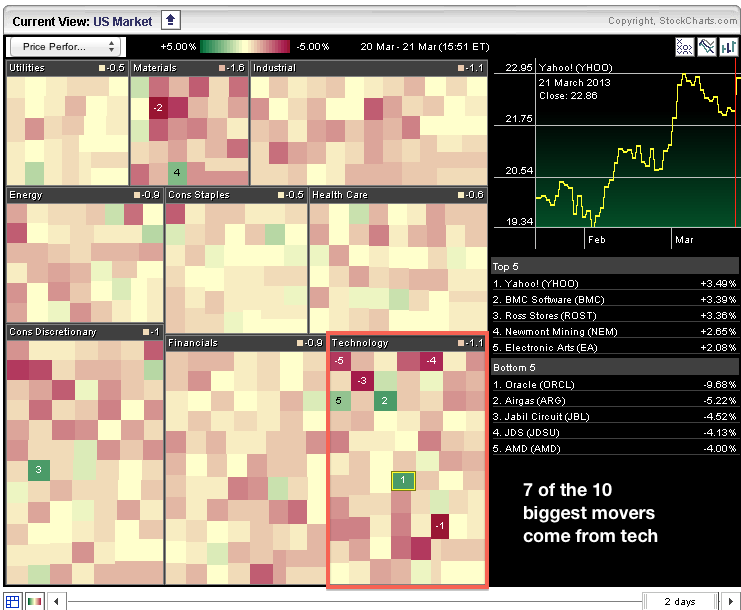
Stocks are under pressure on Thursday and the tech sector is also feeling the heat. Even so, three of the five biggest gainers in the S&P 500 come from technology. Electronic Arts, Yahoo and BMC Software are all trading higher... Read More
Don't Ignore This Chart! March 20, 2013 at 08:49 PM
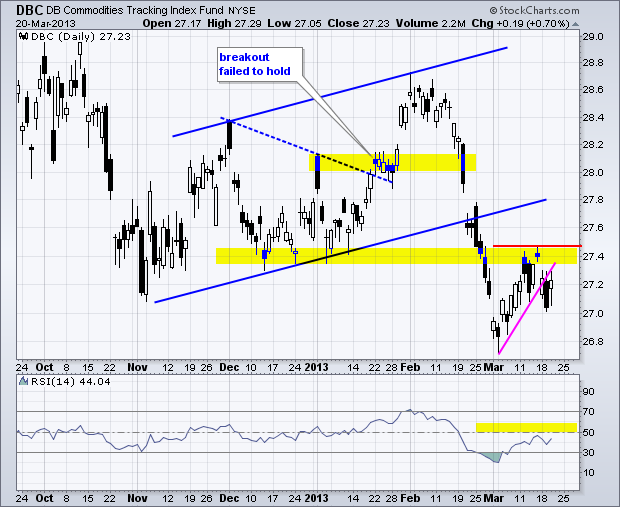
The Commodity Index Fund (DBC) broke down with a sharp decline in February and then rebounded in March. This rebound was cut short when the ETF hit broken resistance and turned down on Monday-Tuesday. Last week's highs now mark the first resistance level to watch... Read More
Don't Ignore This Chart! March 19, 2013 at 03:24 PM
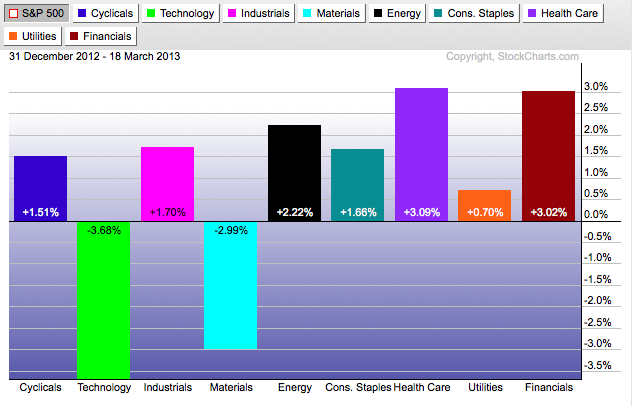
The Healthcare SPDR (XLV) is the top performing sector in 2013. Yes, XLV is even outperforming the Finance SPDR (XLF). Note that the PerfChart below shows relative performance. Sectors with positive relative performance are up more than the S&P 500... Read More
Don't Ignore This Chart! March 18, 2013 at 04:16 PM
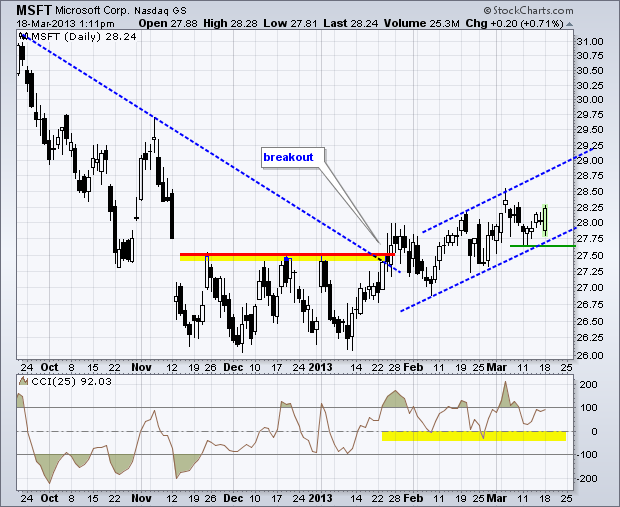
Stocks opened weak, but quickly recovered with techs leading the way. Microsoft (MSFT) opened at 27.81, firmed and then surged with a move above 28.2 by midday. This keeps the rising channel alive. Last week's low marks support on the price chart... Read More
Don't Ignore This Chart! March 15, 2013 at 12:38 PM
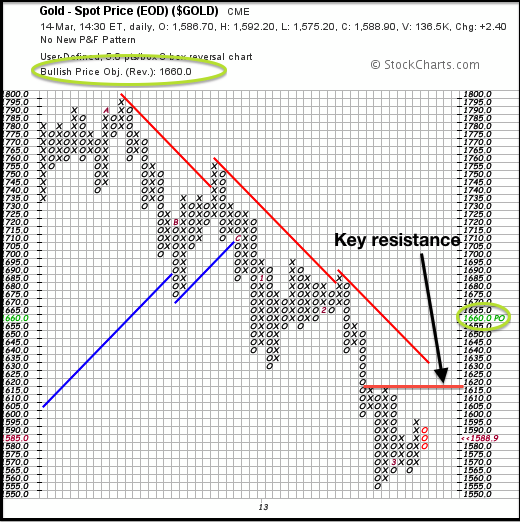
Spot Gold ($GOLD) forged a Double Top Breakout with a surge this month, but remains well short of a bigger breakout that could have medium-term consequences. Notice that February X-Columns marking resistance at 1615... Read More
Don't Ignore This Chart! March 14, 2013 at 04:27 PM
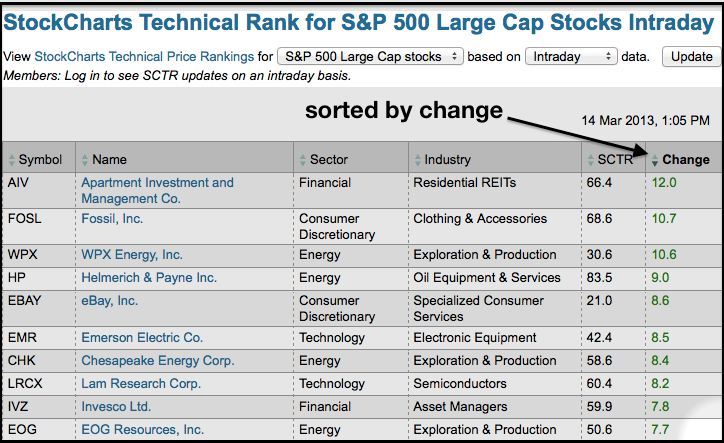
SCTR scores provides a technical ranking for all 500 stocks in the S&P 500. Chartists can view the complete ranking in table format and sort by change to find the biggest movers... Read More
Don't Ignore This Chart! March 13, 2013 at 03:47 PM
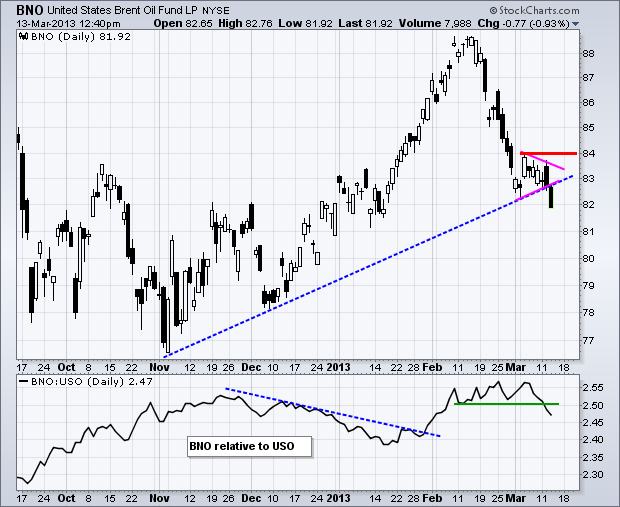
The Brent Crude ETF (BNO) plunged in February and then consolidated with a pennant in early March. This consolidation affirmed support near the trend line extending up from the early November low... Read More
Don't Ignore This Chart! March 12, 2013 at 07:14 PM
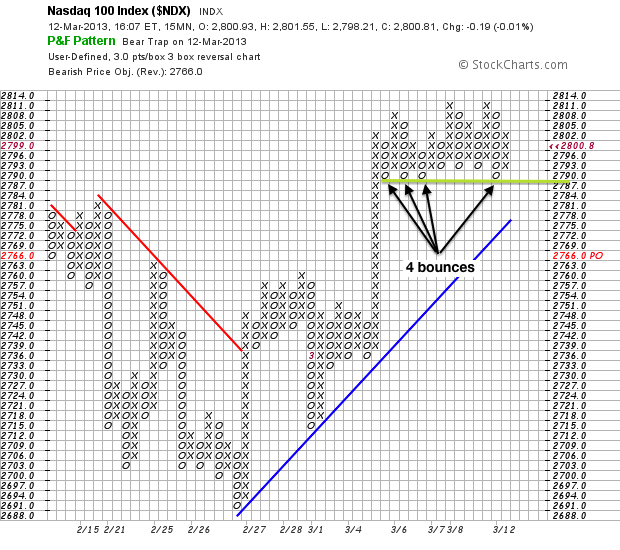
Point & Figure charts are great for identifying support and resistance levels. The chart below shows the Nasdaq 100 ($NDX) bouncing off the 2790 level four times in the past week as a consolidation takes shape. The bulls have a clear edge as long as this level holds... Read More
Don't Ignore This Chart! March 11, 2013 at 04:27 PM
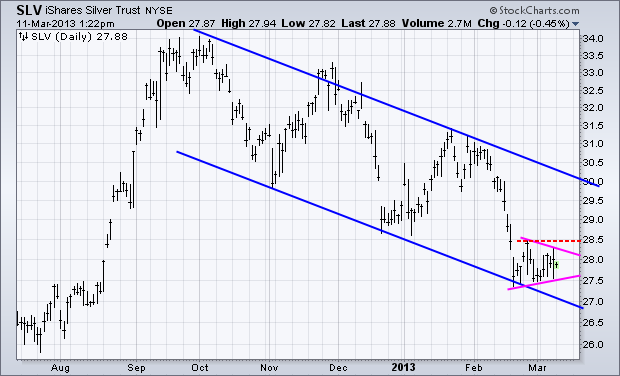
The Silver Trust (SLV) has been working its way lower since early October with a falling channel taking shape. After plunging in February, the ETF firmed near the lower trend line with a pennant. A break below 27.50 would signal a continuation lower, while a break above 28... Read More
Don't Ignore This Chart! March 08, 2013 at 06:23 PM
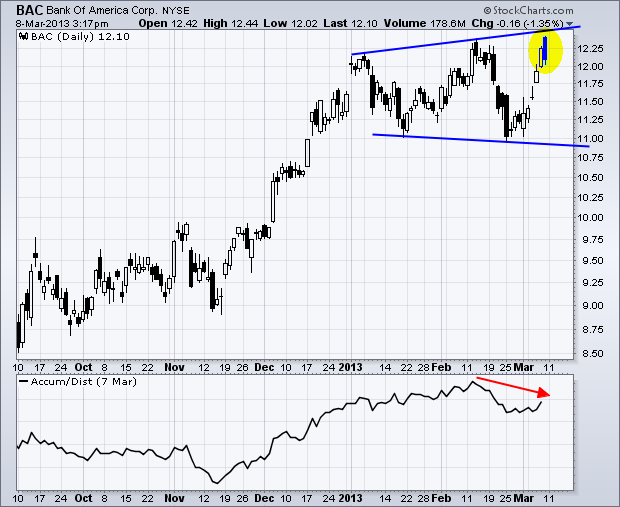
With a strong open and sharp move lower, Bank of America (BAC) is gracing the intraday candlestick scan with a dark cloud as we head into the close on Friday. Note that this bearish reversal pattern is taking shape near resistance from the prior highs... Read More
Don't Ignore This Chart! March 07, 2013 at 04:15 PM
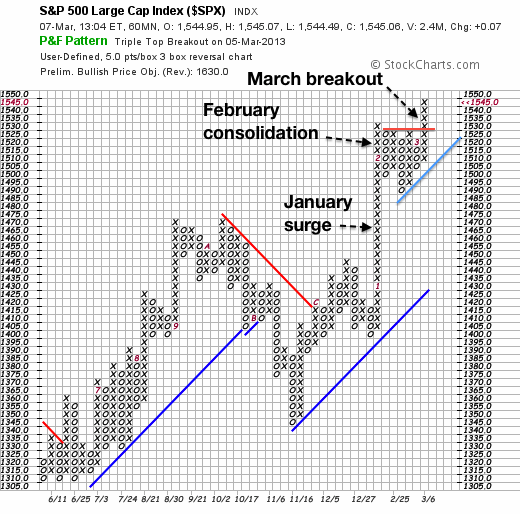
60-minute P&F charts provide a nice medium-term perspective on broad market movements. This S&P 500 chart is based on 5-points per box and a 3-box reversal. Notice that it extends back to June and shows three big price swings... Read More
Don't Ignore This Chart! March 06, 2013 at 07:20 PM
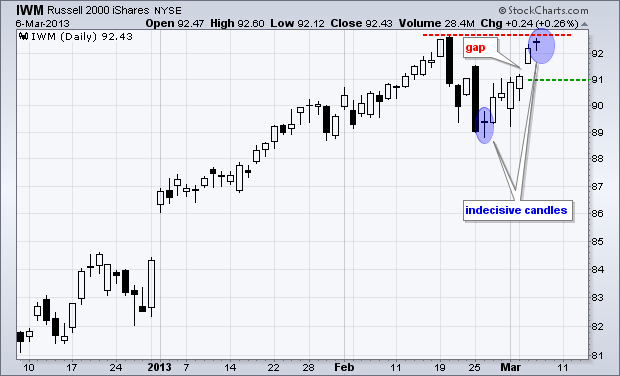
The Russell 2000 ETF (IWM) is up seven days straight and is now trading near potential resistance from the February high. Notice that an indecisive doji formed on Wednesday. A doji and surge above 90 started this seven day rally... Read More
Don't Ignore This Chart! March 05, 2013 at 02:58 PM
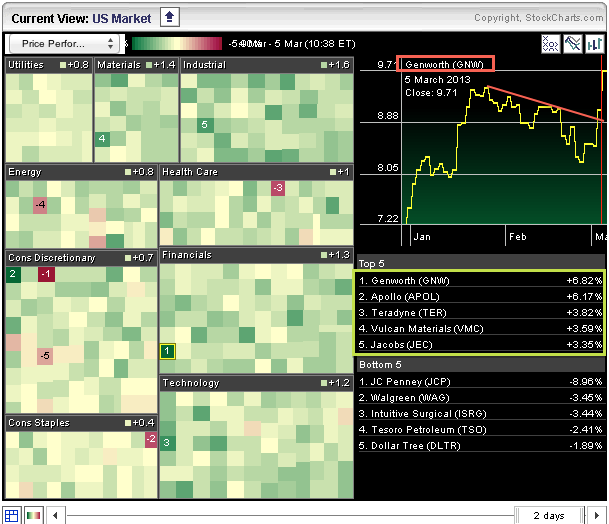
The Sector Market Carpet is showing lots of green as stocks surge with a broad-based rally. All sectors are up with industrials, finance and technology leading the way. Genworth (GNW) is the biggest gainer in the S&P 500, and Apollo (APOL) sports the second largest gain... Read More
Don't Ignore This Chart! March 04, 2013 at 04:36 PM
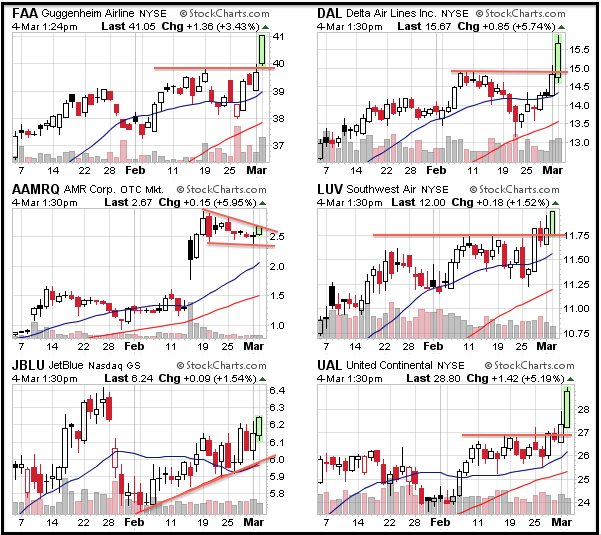
The Guggenheim Airline ETF (FAA) continues to lead the transports with another big move. Note that Delta (DAL) and United Continental Broke consolidations today. AMR has a falling wedge working and could be next... Read More
Don't Ignore This Chart! March 01, 2013 at 02:43 PM
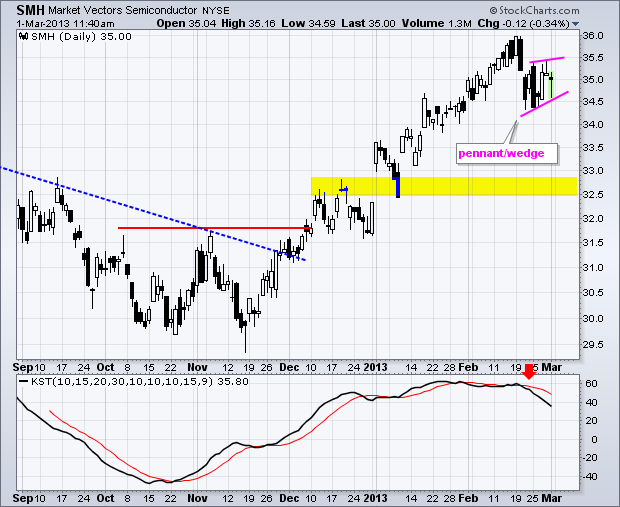
After a sharp decline last week, the Market Vectors Semiconductor ETF (SMH) formed with a small rising wedge the last six days. These are typically bearish continuation pataterns and a break below 34.5 would signal a continuation lower... Read More