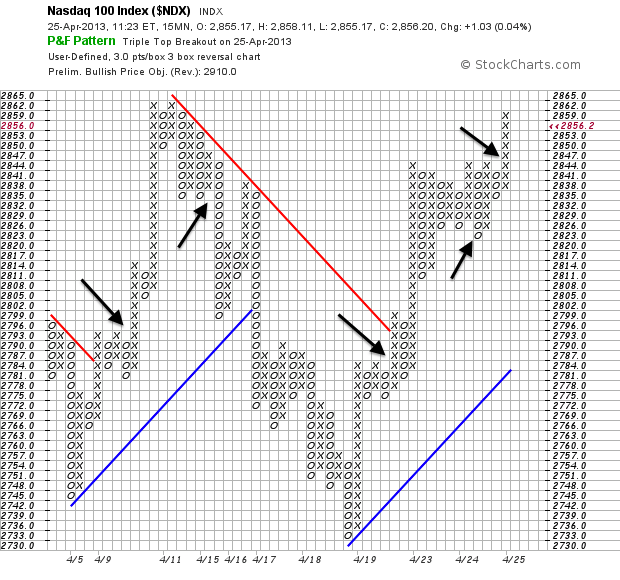
The Nasdaq 100 ($NDX) swings have been quite wild this month, but the 15 minute P&F chart captured these pretty well. In particular, the Triple Top Breakout and Triple Bottom Breakdown identified the early April upswing, the mid April downswing and the upswing over the past week. There was, however, a bad signal just before today's breakout. The black arrows point to these signals.

Click this image for a live chart

Click this image for a live chart

About the author:
Arthur Hill, CMT, is the Chief Technical Strategist at TrendInvestorPro.com. Focusing predominantly on US equities and ETFs, his systematic approach of identifying trend, finding signals within the trend, and setting key price levels has made him an esteemed market technician. Arthur has written articles for numerous financial publications including Barrons and Stocks & Commodities Magazine. In addition to his Chartered Market Technician (CMT) designation, he holds an MBA from the Cass Business School at City University in London.
Learn More


