Don't Ignore This Chart! June 28, 2013 at 07:54 AM
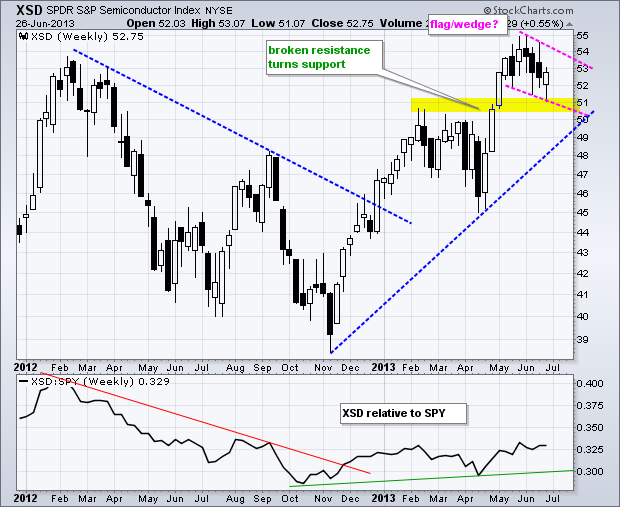
The Semiconductor SPDR (XSD) is consolidating within an uptrend as broken resistance turns first support in the 51 area. A small wedge or pennant formed the last five weeks and a break above 54 would signal a continuation higher. The indicator window shows XSD relative to SPY... Read More
Don't Ignore This Chart! June 27, 2013 at 11:54 AM
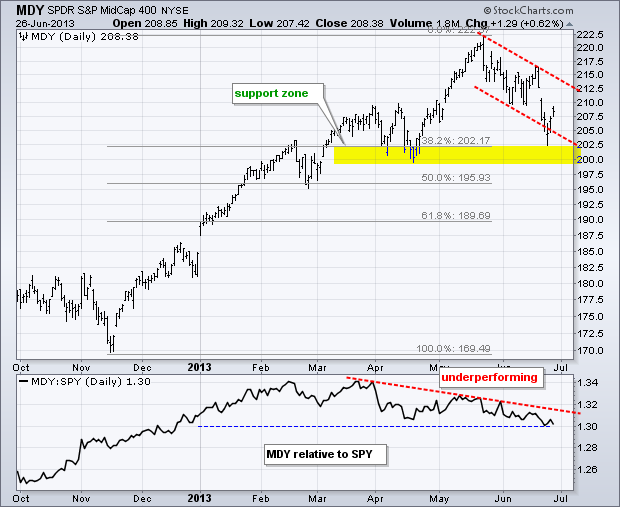
After hitting a new high in mid May, the S&P MidCap 400 SPDR (MDY) fell back towards its April lows in June. Combined with the 38.2% retracement, these lows mark support in the 200-202 area... Read More
Don't Ignore This Chart! June 26, 2013 at 06:36 PM
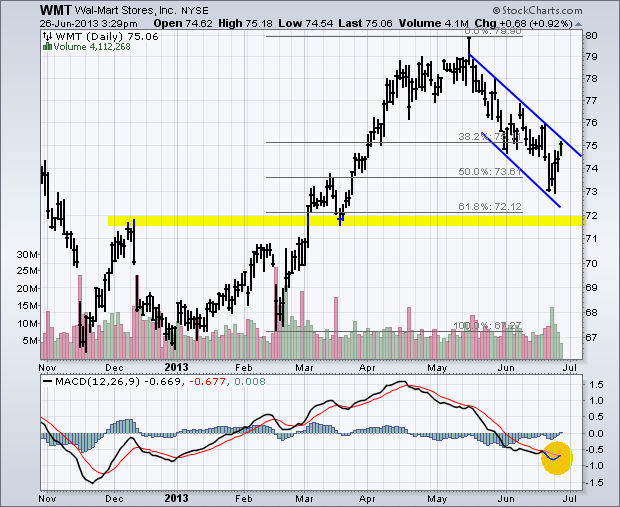
Wal-mart corrected with the rest of the market over the last two months and retraced 50-61.80% of its prior advance with a falling channel. The correction stopped just short of broken resistance in the 72 area as prices surged back above 75 the last few days... Read More
Don't Ignore This Chart! June 25, 2013 at 02:44 PM
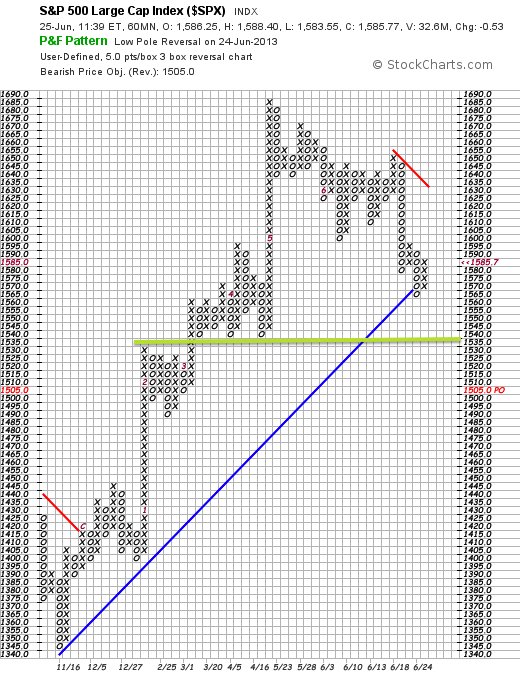
With a move below 1570, the S&P 500 broke the blue Bullish Support Line and a new Bearish Resistance Line has been drawn (red). Looking at price action, there is a lot of support in the 1535-1540 area and this is the next target... Read More
Don't Ignore This Chart! June 24, 2013 at 11:06 AM
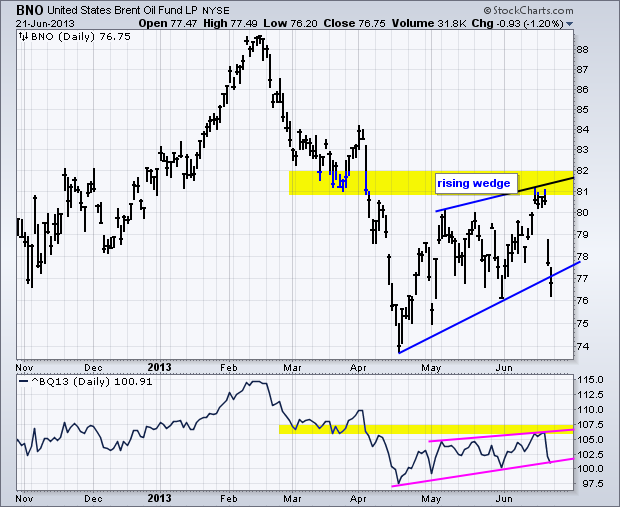
Weakness in stocks and strength in the Dollar weighed on oil as Spot Light Crude ($WTIC) and Brent futures fell sharply. The chart below shows Brent Crude ETF (BNO) breaking wedge support with a plunge below 77... Read More
Don't Ignore This Chart! June 21, 2013 at 11:53 AM
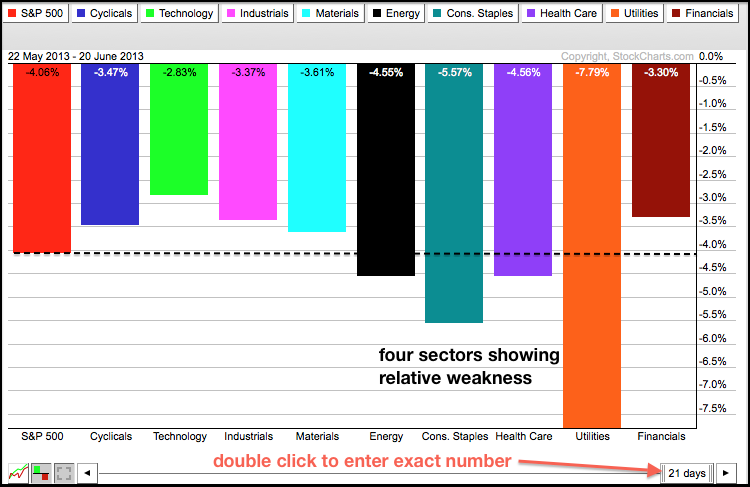
The stock market peaked on May 22 and all sectors are down since then. The S&P 500 is down 4.09%, but the Consumer Staples SPDR (XLP), Healthcare SPDR (XLV) and Utilities SPDR (XLU) are down more and showing relative weakness. XLU is down a whopping 7... Read More
Don't Ignore This Chart! June 20, 2013 at 02:08 PM
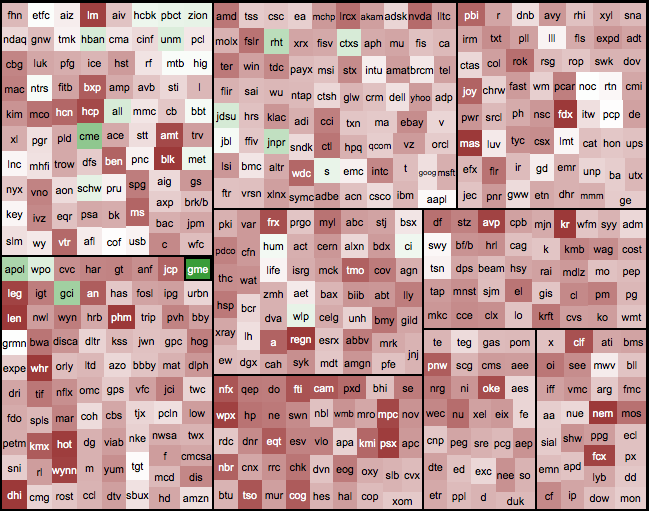
The stock market is down sharply on Thursday, but there are a few green shoots on the sector Market Carpet. In the technology sector, notice that Redhat (RHT), Citrix (CTXS), JDS Uniphase and Juniper (JNPR) are up so far today... Read More
Don't Ignore This Chart! June 19, 2013 at 03:16 PM
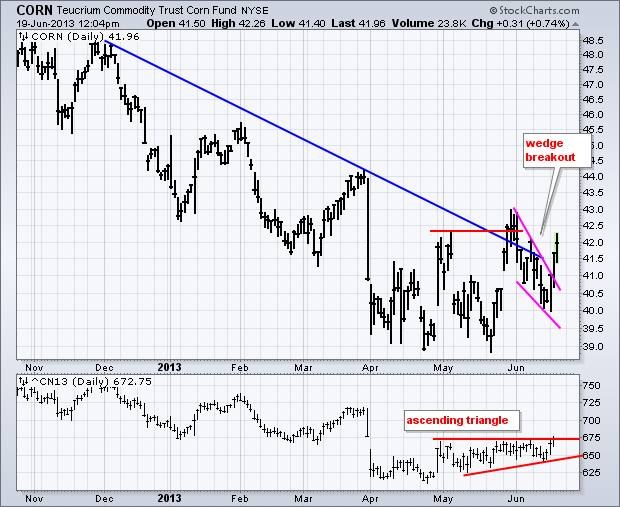
The Corn ETN (CORN) is leading a surge in soft commodities. The chart below shows the ETN breaking out in late May and then falling back in June with a wedge. The wedge low held above the prior lows and the ETN broke wedge resistance with a strong move the last few days... Read More
Don't Ignore This Chart! June 18, 2013 at 03:04 PM
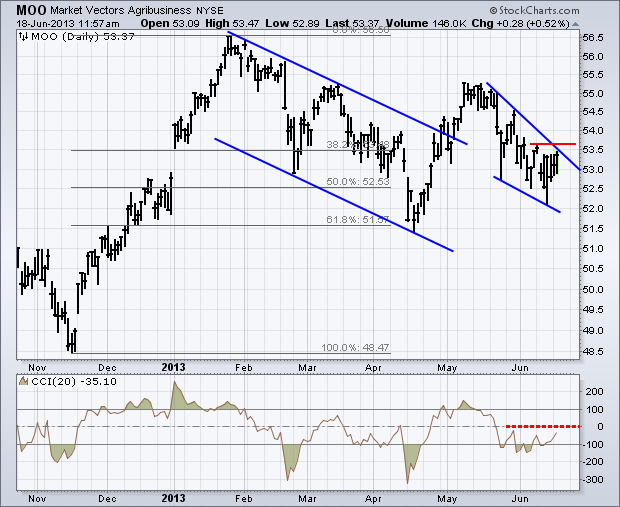
The Agribusiness ETF (MOO) broke channel resistance with a surge above 55, but fell back rather sharply over the last four weeks. The five week trend is down as a falling wedge takes shape... Read More
Don't Ignore This Chart! June 17, 2013 at 05:58 PM
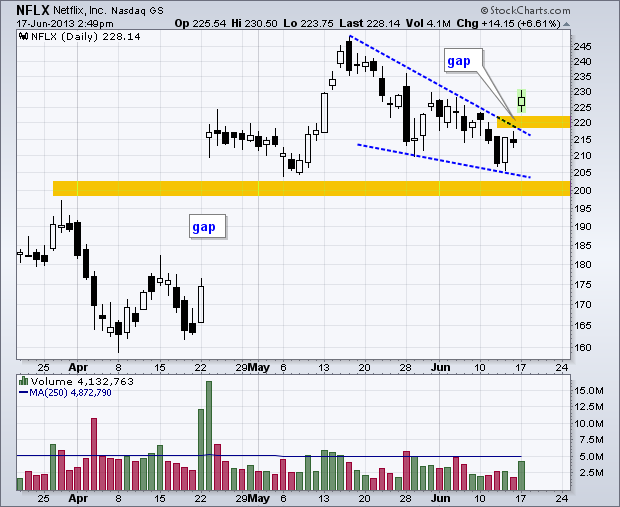
Netflix, which is no stranger to gaps, gapped up in April held this gap throughout May. A falling wedge pushed the stock back toward the gap zone in June, but this wedge ended with a gap on good volume. The breakout-gap is bullish as long as it holds... Read More
Don't Ignore This Chart! June 14, 2013 at 02:43 PM
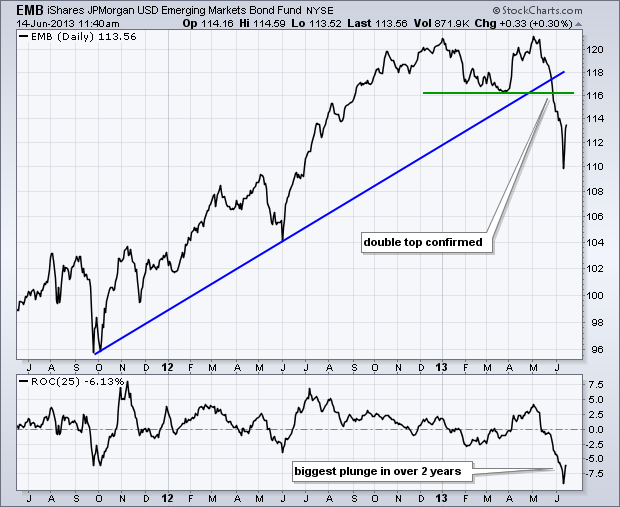
The iShares Emerging Market Bond ETF (EMB) formed a double top from December to May and confirmed this pattern with a support break in late May. Notice that the ETF fell over 8% as rumors of Fed tapering hit the market... Read More
Don't Ignore This Chart! June 13, 2013 at 02:09 PM
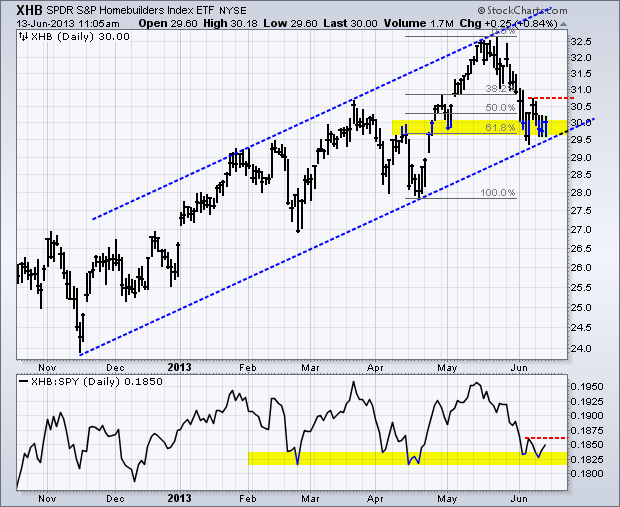
The Homebuilders SPDR (XHB) is finding support with a bounce last week and small gain in early trading on Thursday. Notice that the ETF is trading near the November trend line and the 61.80% retracement. These two items suggest support is at hand... Read More
Don't Ignore This Chart! June 12, 2013 at 12:56 PM
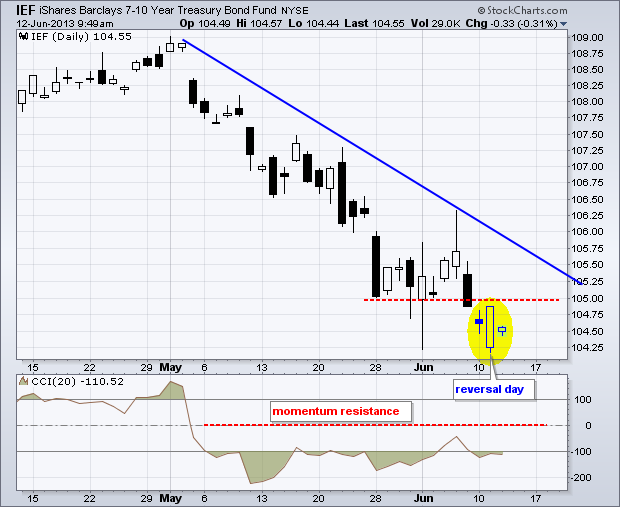
The 7-10 year T-Bond ETF (IEF) opened weak and closed strong on Tuesday to forge an outside reversal day or bullish engulfing pattern. This is potentially positive, but we have yet to see follow through with a break above first resistance at 105... Read More
Don't Ignore This Chart! June 11, 2013 at 02:48 PM
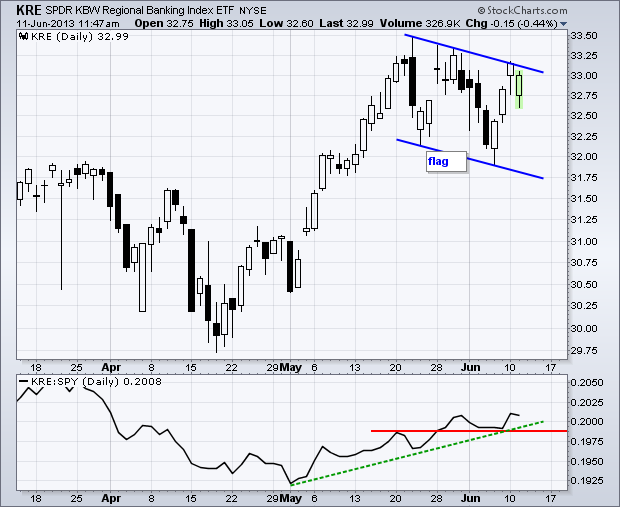
With a bounce after the open on Tuesday, the Regional Bank SPDR (KRE) is showing resilience as it challenges flag resistance. Notice how the ETF surged from mid April to mid May and then corrected with the falling zigzag (flag). A breakout at 33... Read More
Don't Ignore This Chart! June 10, 2013 at 03:15 PM
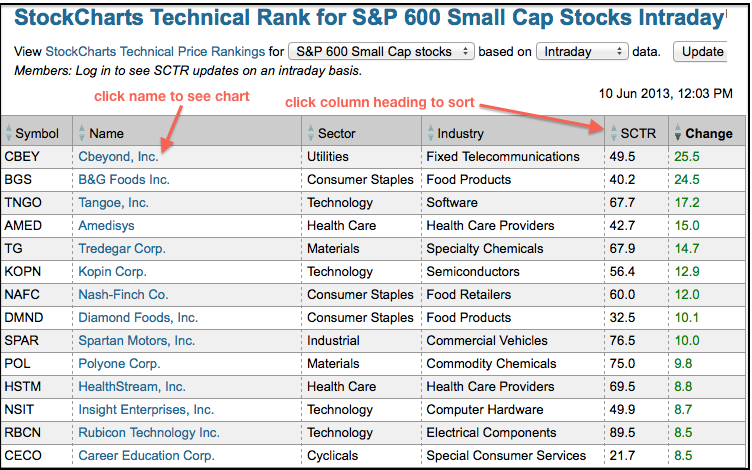
StockCharts Technical Rank (SCTR) for the S&P SmallCap 600 ($SML) ranks 600 small-cap stocks according to their technical strength. Chartists can also sort this table by change to find the bigger (relative) movers... Read More
Don't Ignore This Chart! June 07, 2013 at 03:20 PM
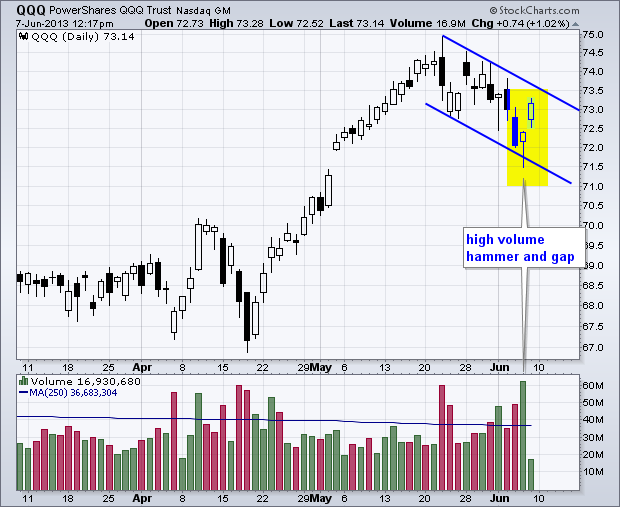
The Nasdaq 100 ETF (QQQ) fell below 72 on Thursday, but rallied to forge a strong close and form a hammer. Also notice that volume surged to its highest in over three months. QQQ followed through with a gap and move above 73, but has yet to break flag resistance just above 73.50... Read More
Don't Ignore This Chart! June 06, 2013 at 02:50 PM
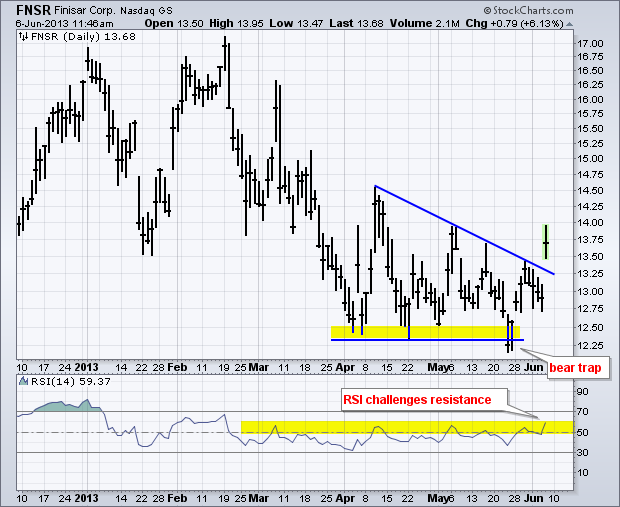
Finisar (FNSR) has had a tough year so far, but the stock is showing signs of life after a bear trap in late May (failed support break) and gap breakout in early June. Also notice that RSI is challenging range resistance and a breakout at 60 would be bullish for momentum... Read More
Don't Ignore This Chart! June 05, 2013 at 09:09 PM
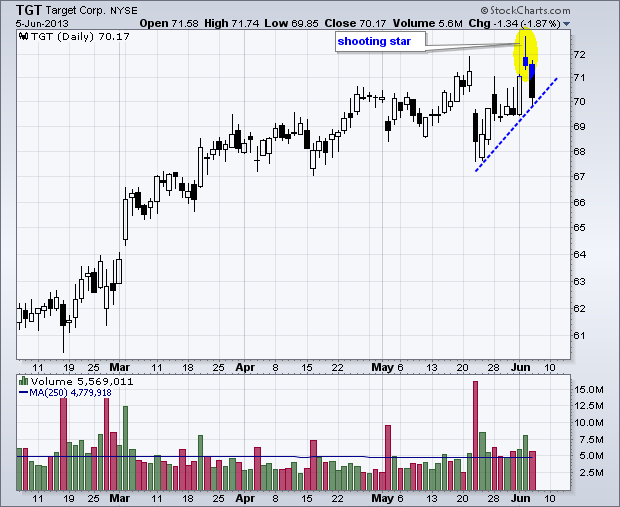
Target (TGT) surged to a new high above 72, but failed to hold above 72 as a shooting star candlestick formed on Tuesday. The stock went on to fill Tuesday's gap with a long filled candlestick on Wednesday. This confirms the shooting star and resistance in the 71-72 area... Read More
Don't Ignore This Chart! June 04, 2013 at 03:23 PM
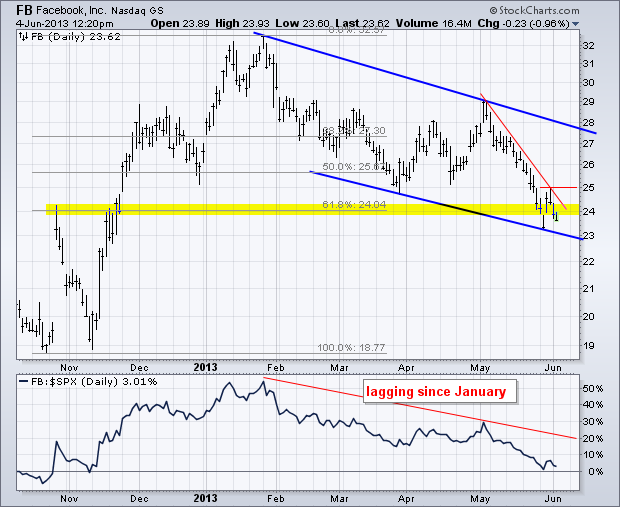
Facebook (FB) led the market from late October until early January, but stumbled in January and has lagged the S&P 500 since. Despite relative weakness and a 4-5 month downtrend, support could be near as the stock trades near the 61.80% retracement and broken resistance... Read More
Don't Ignore This Chart! June 03, 2013 at 01:41 PM
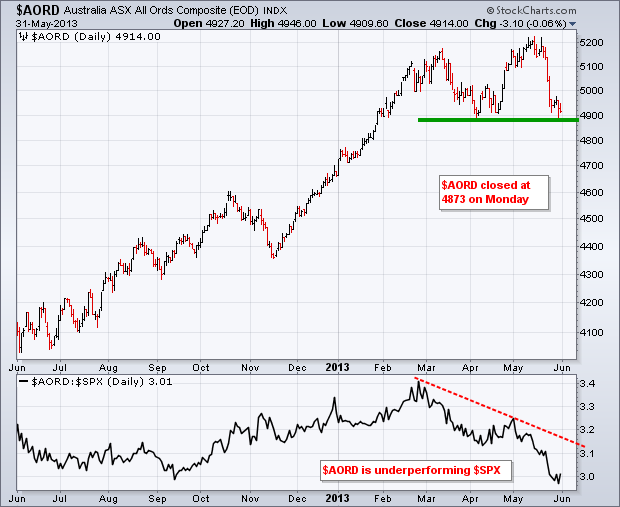
Weakness is spreading in Asia as the Australian All Ords Index ($AORD) breaks support from the April lows. The chart below shows the index testing support last week. $AORD closed at 4873 on Monday, which is just below the April lows... Read More