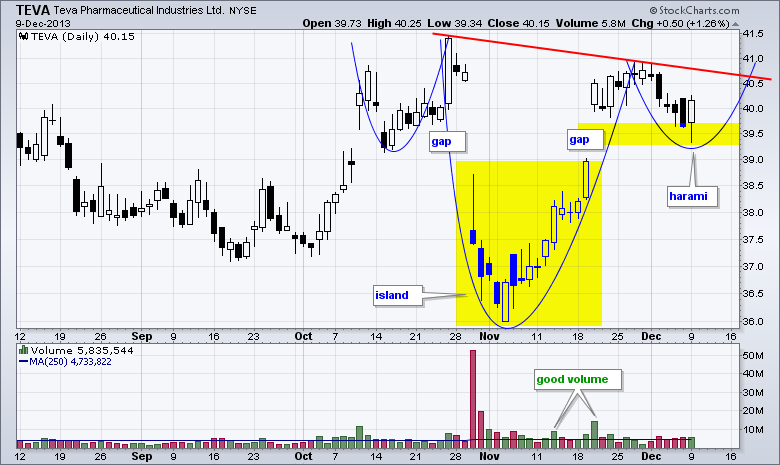
Teva Pharmaceuticals (TEVA) has been all over the place since early October, but two bullish patterns are taking shape and the stock could be poised for a breakout. First, the stock formed a massive island reversal with the late October gap down and the late November gap up. Second, the pattern since mid October looks like be an inverse head-and-shoulders with the red trend line marking the neckline. Notice that upside volume picked up as the stock surged above 40 in November. Short-term, a harami formed on Monday as the stock tested the gap zone. A breakout at 41 would prove bullish here.
Click this image for a live page

About the author:
Arthur Hill, CMT, is the Chief Technical Strategist at TrendInvestorPro.com. Focusing predominantly on US equities and ETFs, his systematic approach of identifying trend, finding signals within the trend, and setting key price levels has made him an esteemed market technician. Arthur has written articles for numerous financial publications including Barrons and Stocks & Commodities Magazine. In addition to his Chartered Market Technician (CMT) designation, he holds an MBA from the Cass Business School at City University in London.
Learn More


