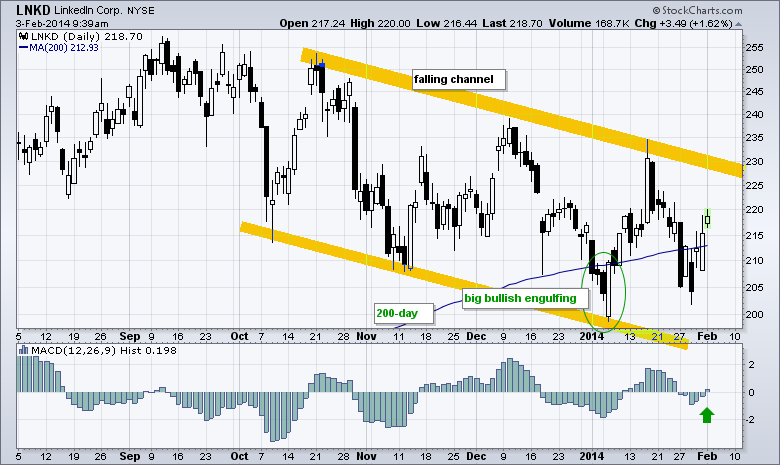
It has been a rough few months for LinkedIn as the stock fell from the 255 area in September to the 200 area in early December. The stock, however, is finding some support near the rising 200-day moving average with a big bullish engulfing. After a pullback in mid January, LinkedIn is again trying to hold this key moving average with a surge the last three days. The indicator window shows the MACD Histogram turning positive on Monday. Earnings are scheduled for February 6th.
Click this image for a live chart

About the author:
Arthur Hill, CMT, is the Chief Technical Strategist at TrendInvestorPro.com. Focusing predominantly on US equities and ETFs, his systematic approach of identifying trend, finding signals within the trend, and setting key price levels has made him an esteemed market technician. Arthur has written articles for numerous financial publications including Barrons and Stocks & Commodities Magazine. In addition to his Chartered Market Technician (CMT) designation, he holds an MBA from the Cass Business School at City University in London.
Learn More


