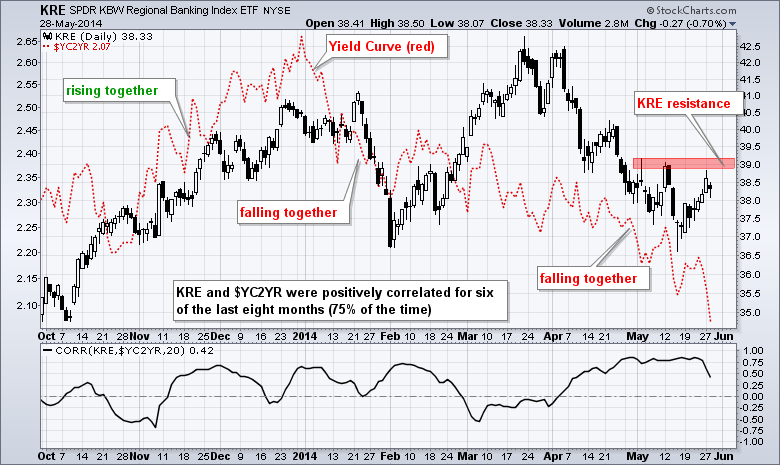
While falling yields translate into lower borrowing costs for the borrower, they are not always positive for the lender. In particular, the recent decline in the 10-Year Treasury Yield ($TNX) caused the spread between the 10-year yield and the 2-year yield to narrow (red dashed line). The chart below shows the spread falling from 2.65 at the beginning of the year to 2.07 this week. Banks make money on this spread and its narrowing translates into lower profits. The indicator window shows that the Regional Bank SPDR (KRE) is positively correlated with the 10-2 Yield Curve ($YC2YR). Notice that the Correlation Coefficient has been positive for six of the last eight months (75% of the time). KRE surged to resistance over the last eight days, but may have trouble breaking out if the yield spread continues to narrow.

Click this image for a live Chart


