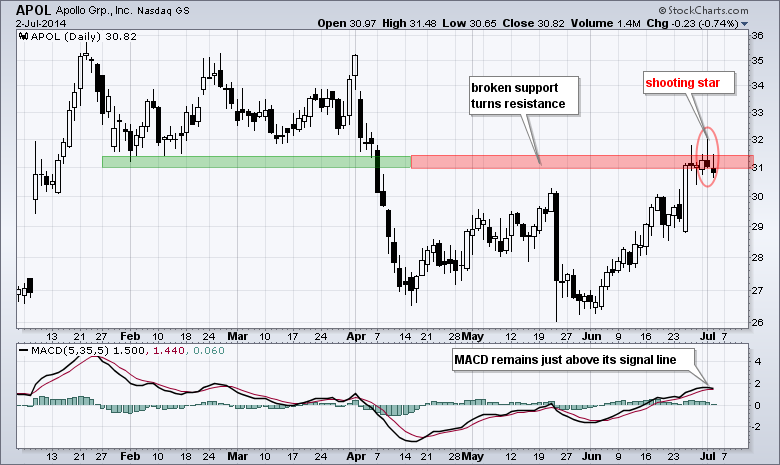
Apollo (APOL) hit resistance at broken support last week and then formed a shooting star this week. This shooting star represents a failed intraday rally. Notice how the stock surged to 32 on Tuesday and then fell to close near 31. This failure also occurred when the market rallied on Tuesday. The indicator window shows MACD(5,35,5) just above its signal line. A move below the signal line would indicate a downturn in upside momentum.
Click this image for a live chart

About the author:
Arthur Hill, CMT, is the Chief Technical Strategist at TrendInvestorPro.com. Focusing predominantly on US equities and ETFs, his systematic approach of identifying trend, finding signals within the trend, and setting key price levels has made him an esteemed market technician. Arthur has written articles for numerous financial publications including Barrons and Stocks & Commodities Magazine. In addition to his Chartered Market Technician (CMT) designation, he holds an MBA from the Cass Business School at City University in London.
Learn More