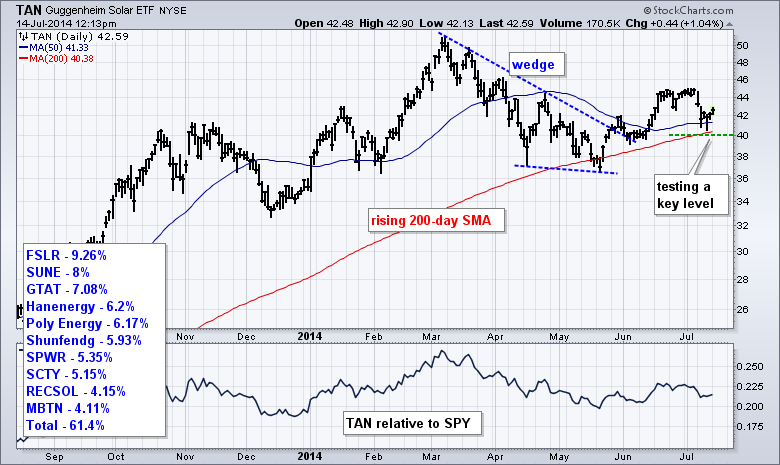
After a wedge breakout in late May, the Solar Energy ETF (TAN) is testing this breakout and two key moving averages in July. Notice how the 50-day and 200-day moving averages converge in the 40-41 area. TAN is currently above both and the 50-day is above the 200-day. The bias is still positive, but a move below 40 would break both moving averages and turn the bias bearish.
Click this image for a live chart

About the author:
Arthur Hill, CMT, is the Chief Technical Strategist at TrendInvestorPro.com. Focusing predominantly on US equities and ETFs, his systematic approach of identifying trend, finding signals within the trend, and setting key price levels has made him an esteemed market technician. Arthur has written articles for numerous financial publications including Barrons and Stocks & Commodities Magazine. In addition to his Chartered Market Technician (CMT) designation, he holds an MBA from the Cass Business School at City University in London.
Learn More