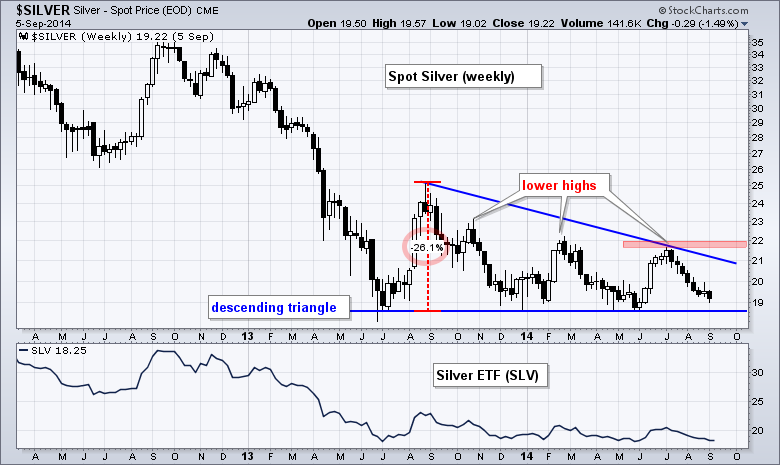
The chart below shows Spot Silver ($SILVER) consolidating after a sharp decline. Notice that the metal fell from 35 to 19 and then traded flat from June 2013 until now. With lower highs taking shape, a descending triangle has formed and this is a bearish continuation pattern. A break below support would signal a continuation lower and project a 26% decline from the support break. Chartists can mark resistance at 22.
Click this image for a live page

About the author:
Arthur Hill, CMT, is the Chief Technical Strategist at TrendInvestorPro.com. Focusing predominantly on US equities and ETFs, his systematic approach of identifying trend, finding signals within the trend, and setting key price levels has made him an esteemed market technician. Arthur has written articles for numerous financial publications including Barrons and Stocks & Commodities Magazine. In addition to his Chartered Market Technician (CMT) designation, he holds an MBA from the Cass Business School at City University in London.
Learn More


