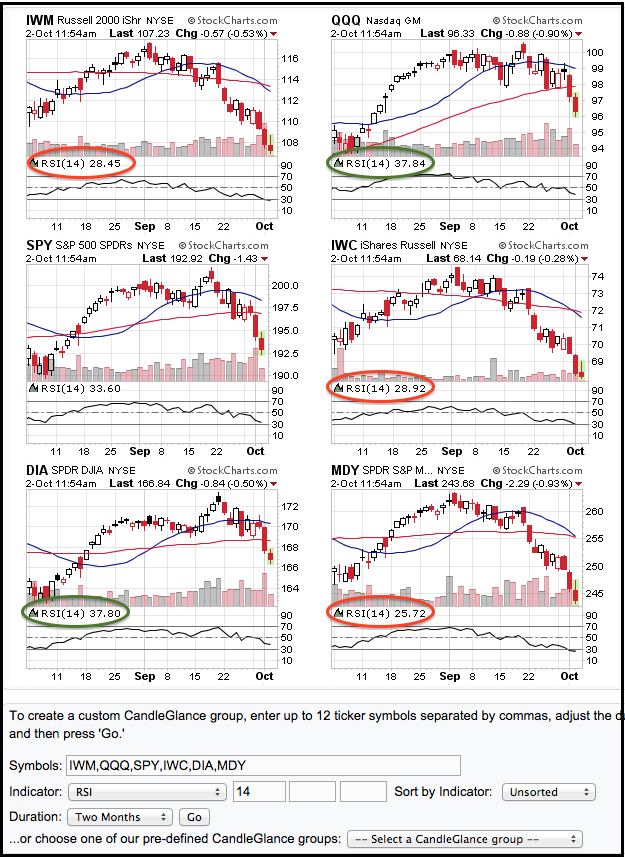
The CandleGlance chart below shows six broad-market ETFs with 14-day RSI. Notice that RSI is below 30 for the Russell 2000 iShares, the Russell MicroCap iShares and the S&P MidCap SPDR. With an RSI below 26, the S&P MidCap SPDR is the most oversold of the six. In fact, 14-day RSI is the lowest it has been since May 2012. How's that for oversold? The Nasdaq 100 ETF and Dow Diamonds are holding up the best because their RSI values are above 37. As the image below shows, chartists can chart 12 symbols in CandleGlance format and add different indicators to these charts.
Click this image for a live chart

About the author:
Arthur Hill, CMT, is the Chief Technical Strategist at TrendInvestorPro.com. Focusing predominantly on US equities and ETFs, his systematic approach of identifying trend, finding signals within the trend, and setting key price levels has made him an esteemed market technician. Arthur has written articles for numerous financial publications including Barrons and Stocks & Commodities Magazine. In addition to his Chartered Market Technician (CMT) designation, he holds an MBA from the Cass Business School at City University in London.
Learn More


