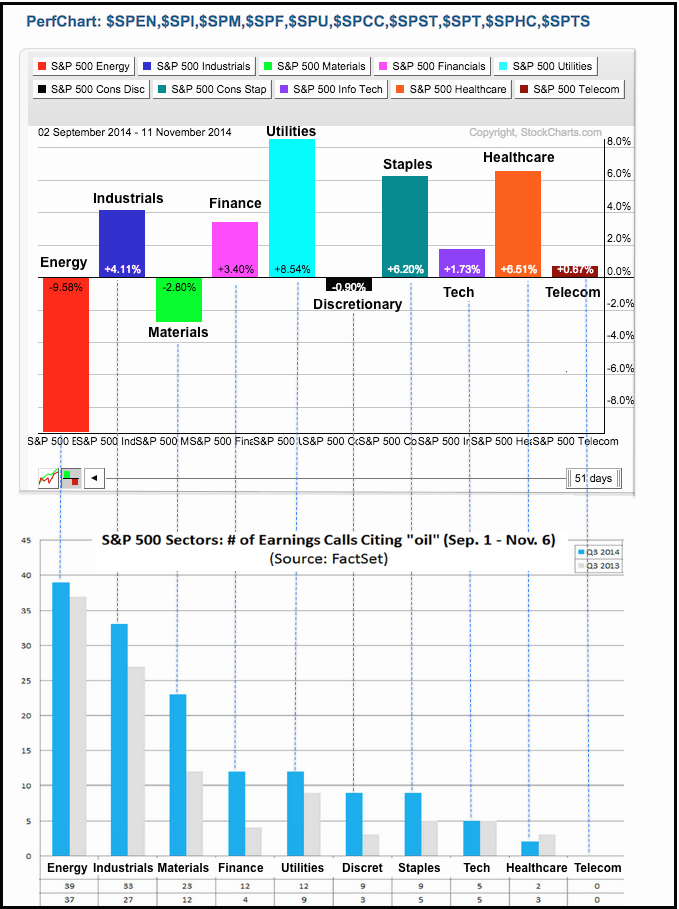
The top chart shows sector performance since the beginning of September. The bottom chart, from factset.com, shows the number of times companies in these sectors cited oil in their earnings calls (from 1-Sep to 6-Nov). Oil fell around 10% from mid June to late August and around 20% from early September to early November. Unsurprisingly, companies in the energy sector cited oil the most and the S&P Energy Sector ($SPEN) is down around 10% since early September. The S&P Industrials Sector ($SPI) appears to be a big beneficiary because these companies cited oil 33 times and the sector is up over 4%. It is the strongest non-defensive sector over this timeframe. It appears that industrial companies are the big beneficiaries of cheaper oil. Companies in the materials sector cited oil 23 times and this sector is the second worst performing sector. It is interesting that companies in the consumer discretionary have not cited falling oil prices much. The decline in gasoline prices should free up more money for retail spending as we head into the holiday season.
Click this image for a live chart.


