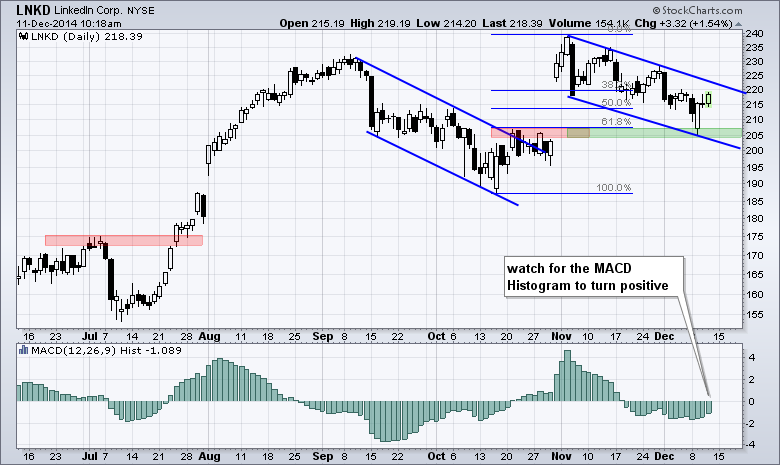
LinkedIn broke out and surged to a new high in early November, and then corrected the last five weeks with a falling channel. This channel retraced 62% of the prior surge and almost filled the gap, but didn't. Throw in support from broken resistance in the 205 area, and the stock is setting up for a potential move higher. A channel break would trigger a price signal and a bullish momentum signal would trigger if the MACD Histogram turns positive.

Click this image for a live chart.

About the author:
Arthur Hill, CMT, is the Chief Technical Strategist at TrendInvestorPro.com. Focusing predominantly on US equities and ETFs, his systematic approach of identifying trend, finding signals within the trend, and setting key price levels has made him an esteemed market technician. Arthur has written articles for numerous financial publications including Barrons and Stocks & Commodities Magazine. In addition to his Chartered Market Technician (CMT) designation, he holds an MBA from the Cass Business School at City University in London.
Learn More


