The Energy SPDR (XLE) is in a long-term downtrend and it looks like the short-term uptrend reversed over the last few days. The chart below shows XLE failing at the falling 200-day moving average with a bearish engulfing last week and breaking below short-term support at 81. The ETF bounced above 81 on Friday, but fell back below 81 with a sharp decline on Monday. The bearish engulfing is confirmed and short-term support has been broken. Also note that XLE is the weakest of the nine sector SPDRs because it has the lowest StockCharts Technical Rank (SCTR) of the nine. A small ranking table is shown after the jump.
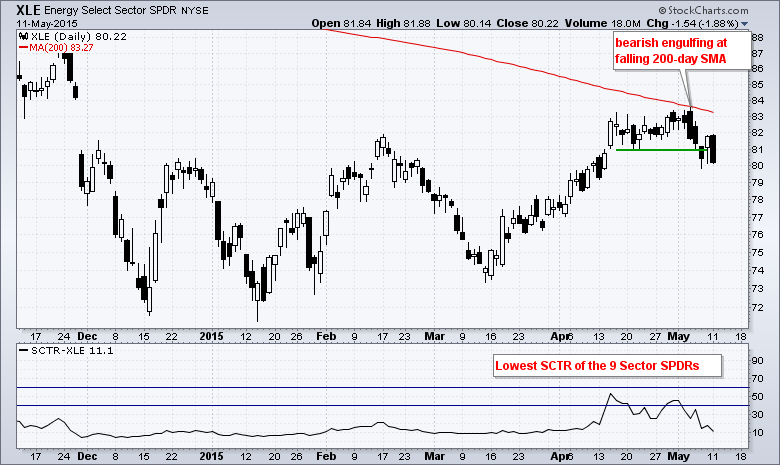
Click this image for a live chart.
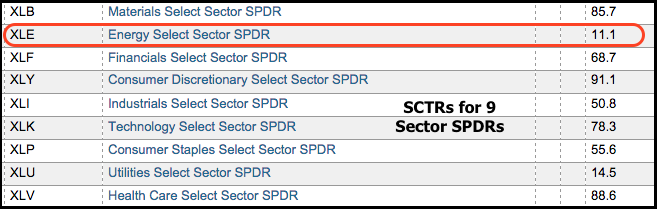
Click this image for a live table.

About the author:
Arthur Hill, CMT, is the Chief Technical Strategist at TrendInvestorPro.com. Focusing predominantly on US equities and ETFs, his systematic approach of identifying trend, finding signals within the trend, and setting key price levels has made him an esteemed market technician. Arthur has written articles for numerous financial publications including Barrons and Stocks & Commodities Magazine. In addition to his Chartered Market Technician (CMT) designation, he holds an MBA from the Cass Business School at City University in London.
Learn More