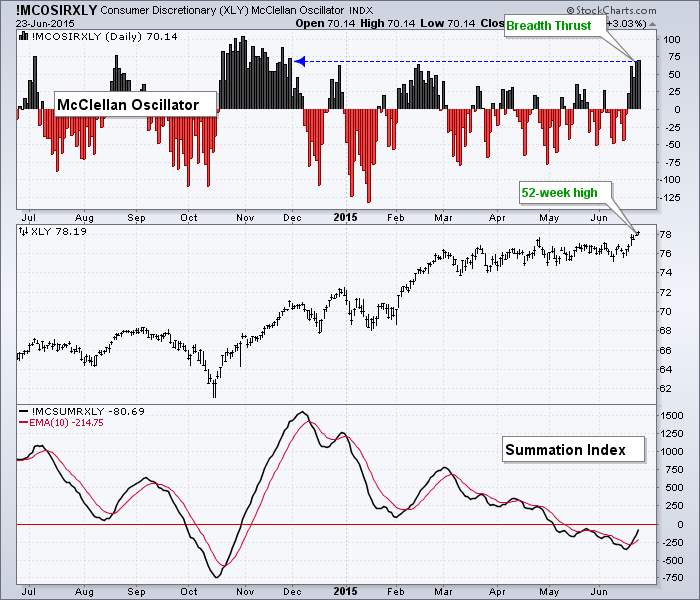
StockCharts users have access to the McClellan Oscillators and Summation Indices for the nine sector SDDRs and the major stock indices. Before showing how to find these symbols, let's take a look at the McClellan Oscillator and McClellan Summation Index for the Consumer Discretionary SPDR (XLY). The chart below shows the McClellan Oscillator surging to its highest level since November 28th. With three readings above 50 the last four days, it is clear we have a breadth thrust to go along with the new 52-week high in the underlying ETF (XLY). The bottom window shows the Summation Index moving into negative territory in early May and staying in negative territory. The Summation Index turned up and broke its 10-day EMA, but more strength is needed to turn positive again. Note that the Summation Index is a running total of the McClellan Oscillator values. You can read more about these indicators in our ChartSchool article.

Click this image for a live chart
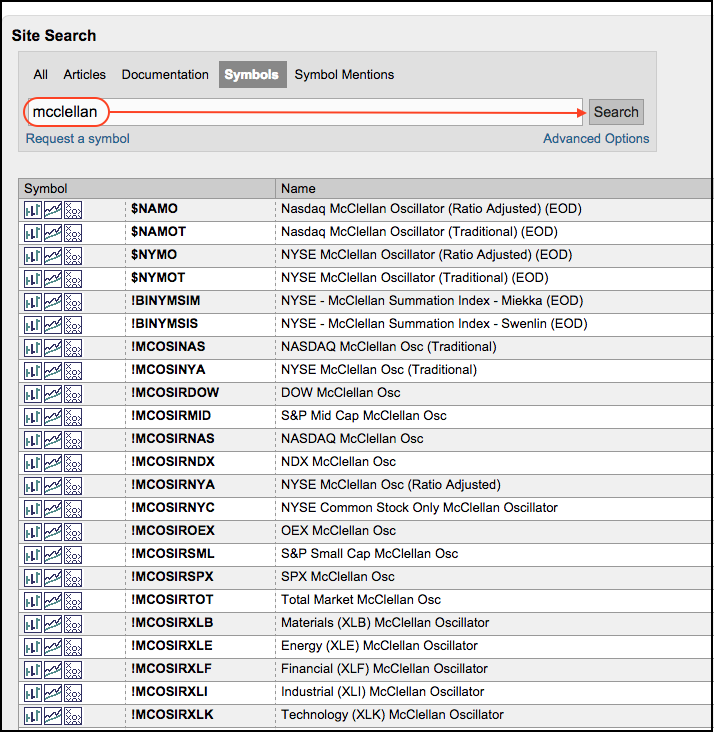
Chartists can find the symbols for the McClellan Oscillator and Summation Index by searching for the term "mcclellan" (without quotations). The root of the McClellan Oscillator symbol is !MCOSIR and the corresponding index/ETF symbol is added to this root. Thus !MCOSIR + XLY = !MCOSIRXLY, which is the symbol for the XLY McClellan Oscillator. Chartists simply need to change the suffix of the symbol. Of the major stock indices, only the Small-caps and Mid-cap Summation Indices are in positive territory. Of the nine sector SPDRs, only the finance and industrials summation indices are in positive territory.

Click this image to see the symbol catalog.


