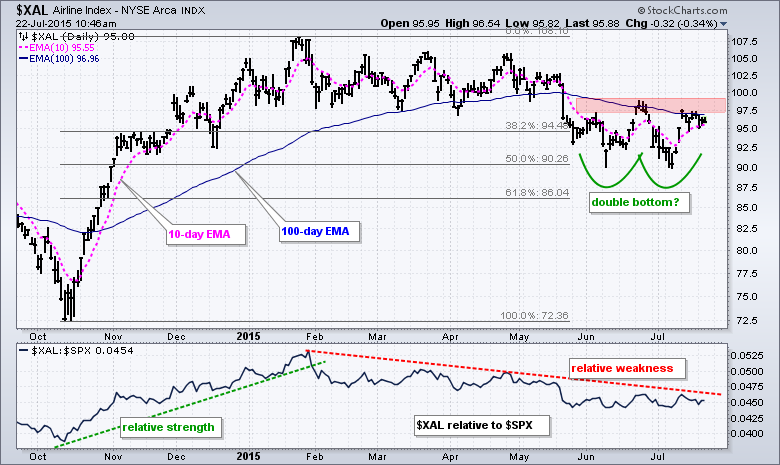
The Airline Index ($XAL) has been a real dog in 2015, but the index is showing signs of support and a double bottom could be emerging. The chart below shows $XAL peaking in January and moving lower the last six months. The 10-day EMA is below the 100-day EMA and the trend is clearly down. Signs of support are emerging because the index bounced off the June low in early July.

Click this image for a live chart
Note that Tom Bowley featured the DJ US Airline Index ($DJUSAR) in his Trading Places blog as the index tested support in early July. It was a timely post that may prove even more timely for this group. Turning back to $XAL, the two lows suggest that a double bottom may be forming with the late June high marking resistance. A breakout here would confirm the double bottom and reverse the 2015 downtrend.
The indicator window shows $XAL relative to the S&P 500 using the price relative ($XAL:$SPX ratio). $XAL still shows relative weakness, but the price relative flattened in June-July. A break above the June high would signal a return to relative strength in $XAL.
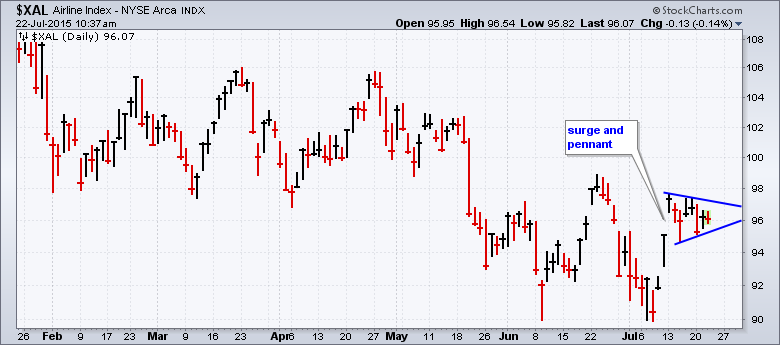
Short-term, the chart above shows $XAL with a surge and a pennant. Pennants are short-term continuation patterns that represent a rest after a sharp move. A move above 97.5 would trigger a pennant breakout and this would increase the odds of a double bottom breakout. Chartists interested in individual airlines can check out these charts: AAL, ALK, HA, JLBU, SAVE, SKYW, UAL


