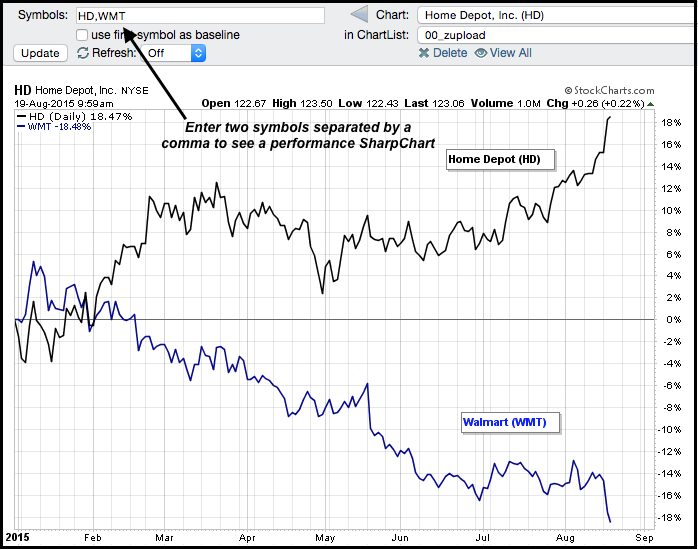
Just ask HD and WMT. These two big retail stocks are part of the Dow Industrials and the S&P 500. Despite a common industry group, the performance for these two stocks could not be any more different. The chart below shows year-to-date performance for Home Depot (HD) and Wal-Mart (WMT). One is up around 18% and the other is down around 18%. Note that Chartists can create a performance SharpChart by entering two or more comma-separated symbols in the symbol entry box. We'll look at these charts individually after the jump.

Click this image for a live chart
Wal-Mart Meets Chart Expectations
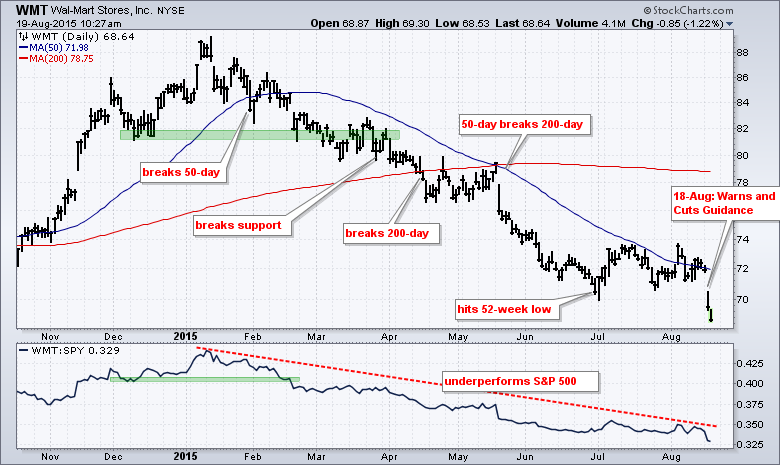
Wal-Mart missed earnings on August 18th and cut guidance. Should we have been surprised? Technical analysts and chartists were not surprised because there were a string of bearish developments well before this warning. Of note, the stock broke support in March, the 50-day SMA turned down in March and the stock broke the 200-day in mid April. The downtrend was long underway and the market was already pricing in bad news before this warning hit.

Click this image for a live chart
Home Depot Beats Chart Expectations
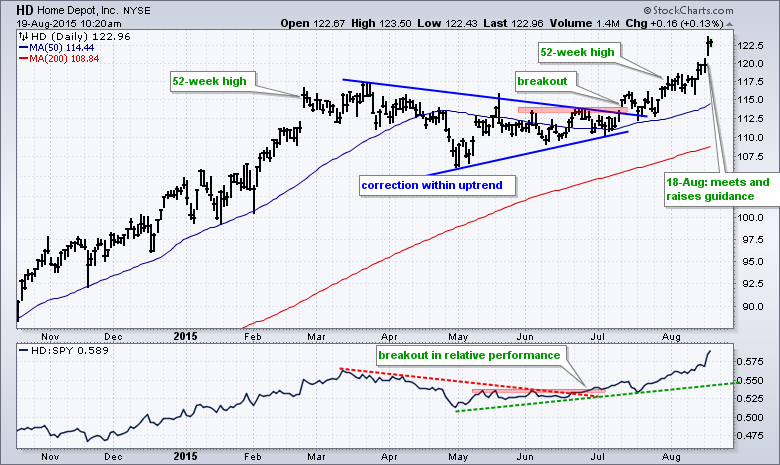
In contrast to Wal-Mart, Home Depot met earnings estimates and raised guidance on August 18th. This was not a surprise either because the stock was already trending higher and outperforming the S&P 500. HD hit new highs earlier this year and then corrected into June. The stock broke out in July and hit new highs again in late July and August. Notice that the price relative (HD:$SPX ratio) broke out in late June, a few weeks before the stock. This relative strength breakout provided a nice heads up for the price breakout on the chart.

Click this image for a live chart
Moral of the Story
There is information in price action because the market often prices in the news before it happens.
Thanks for tuning in and have a great day!
Arthur Hill CMT


