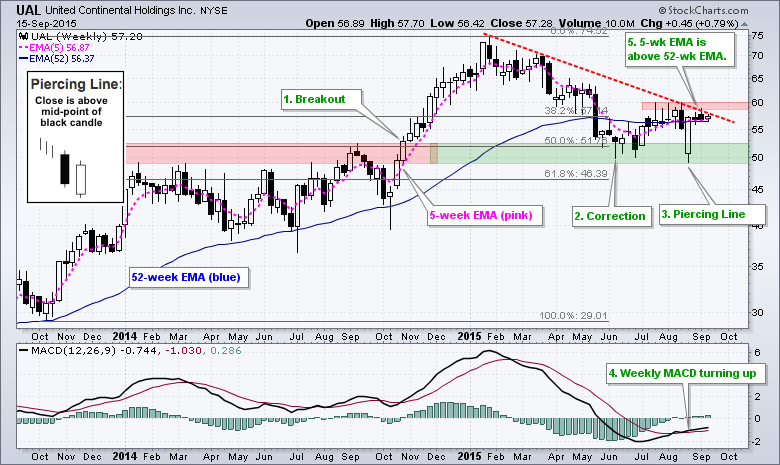
The weekly chart for United Airlines (UAL) is looking bullish as the stock firms in a key retracement zone and weekly MACD turns up. The green text on the chart marks five technical features over the last 15 months. First, the stock broke out to new highs in October 2014. After surging above 70, the stock corrected with a 50-62% retracement that returned to the breakout zone. This looks like a classic advance-correction sequence because the retracement amount is typical for corrections and the stock firmed at broken resistance. Signs of strength began to emerge as the stock formed a big piercing pattern four weeks ago and the weekly MACD indicator turned up. Also notice that the 5-week EMA moved above the 52-week EMA. Despite a bullish backdrop, the stock remains short of a breakout and has yet to confirm the piercing pattern. A close above 60 is needed to trigger a bullish breakout on this weekly chart. I will look at the daily chart after the jump.
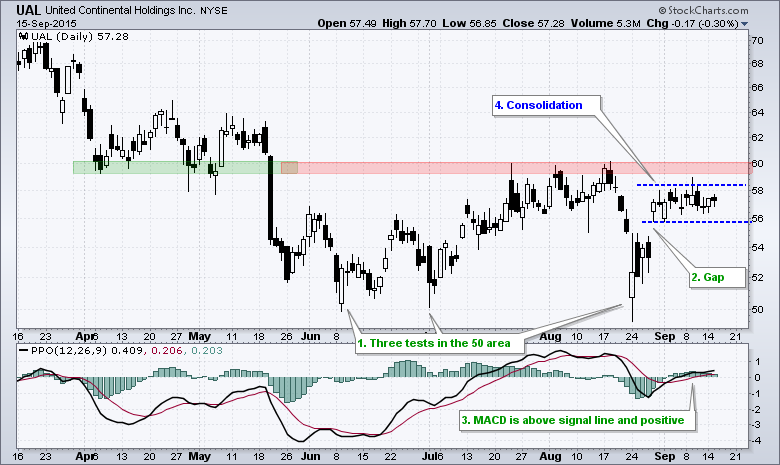
The daily UAL chart shows four technical features. First, the stock tested the 50 area three times from June to August. After the third test, the stock surged above 56 with a gap and this gap has held for twelve days. Even though we have yet to see follow thru, the gap and surge are positive until proven otherwise (gap filled). The third item shows MACD moving above its signal line and turning positive, which means short-term momentum is bullish. And finally, the fourth item is the 12-day consolidation in the 56-58 area. This pattern resembles a flat flag after a surge and a breakout would be bullish. At this point, I have a bullish bias on UAL and will turn outright bullish with breakouts. A close below 54 would fill the gap and argue for a reassessment.
******************************************
Thanks for tuning in and have a great day!
--Arthur Hill CMT
Plan your Trade and Trade your Plan
*****************************************


