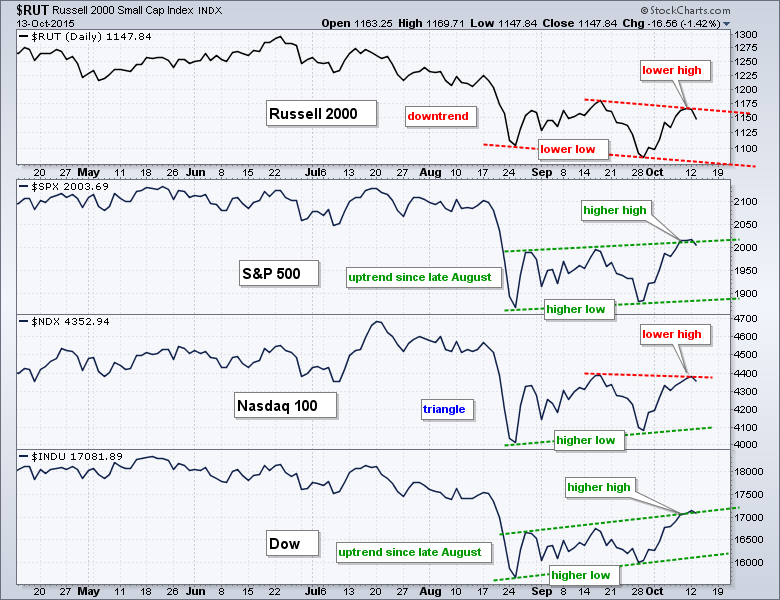
Price action has been rather volatile since the August breakdown, but some performance discrepancies are emerging in October and these could foreshadow broad market weakness. The chart below shows the Russell 2000, S&P 500, Nasdaq 100 and Dow Industrials, all on one chart for easy comparison. First, notice that the S&P 500 and Dow Industrials formed higher lows and higher highs from late August to mid October. These two have slight uptrends at work with rising channels taking shape the last two months.
In contrast to the S&P 500 and Dow, the Russell 2000 formed a lower low in late September and did not exceed its mid September high. Small-caps are still trending lower because of the lower low and they show relative weakness because the Russell 2000 did not exceed the mid September high. The Nasdaq 100 is somewhere in the middle because it formed a higher low in late September, but did not exceed the mid September high and could be forming a lower high. Overall, a triangle could be emerging in the Nasdaq 100.
Bottom line: The Russell 2000 and the Nasdaq 100 clearly show less strength than the S&P 500 and Dow Industrials because they did not exceed their mid September highs. Relative weakness in these two key groups could foreshadow weakness in the broader market.
****************************************
Thanks for tuning in and have a good day!
--Arthur Hill CMT
Plan your Trade and Trade your Plan
****************************************


