No signal is perfect, but the relative performance of consumer stocks is one to watch. The reason is simple. When consumer discretionary stocks (XLY) outperform their consumer staples counterparts (XLP), a bet is being made by market participants that our economy is strong or appears to be strengthening. Keep in mind that consumer discretionary stocks sell the products that people WANT while consumer staples stocks sell the products that people NEED. The latter group represents things like soap, deodorant and toothpaste. If you're worried about your job or your declining home price, you'll still brush your teeth (hopefully). However, that $5 latte at Starbucks (discretionary item) is likely to bite the dust. So it's always important to see how this ratio (XLY:XLP) stacks up against the S&P 500 ($SPX). Take a look at this chart:
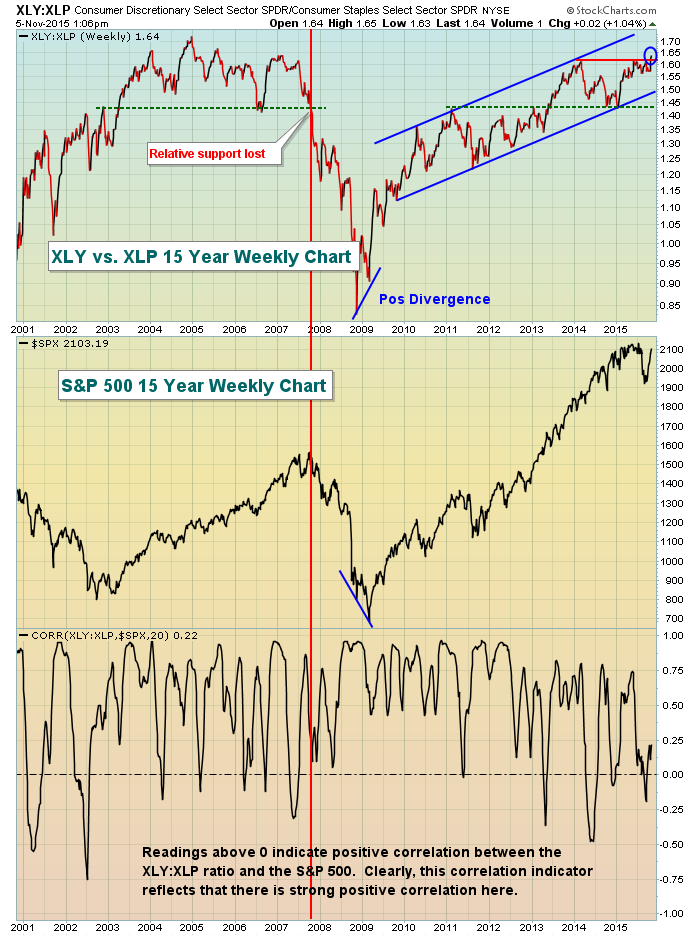
The relative uptrend in the XLY vs. XLP continues and we just saw a breakout to the upside. This suggests that, based on consumer stock performance, traders are expecting a brighter economic picture ahead, which in turn should help the S&P 500 push to new all-time highs. The correlation indicator above is very positive with nearly all readings over a 15 year period above the zero line. Therefore, we need to pay attention to what consumer stocks are telling us. In 2014, the relative ratio of the XLY:XLP was falling, but note we never lost relative support - very important. In 2007, as the S&P 500 was near its high, the XLY:XLP ratio was tumbling and lost relative support. That's a HUGE difference between then and now.
Happy trading!
Tom


