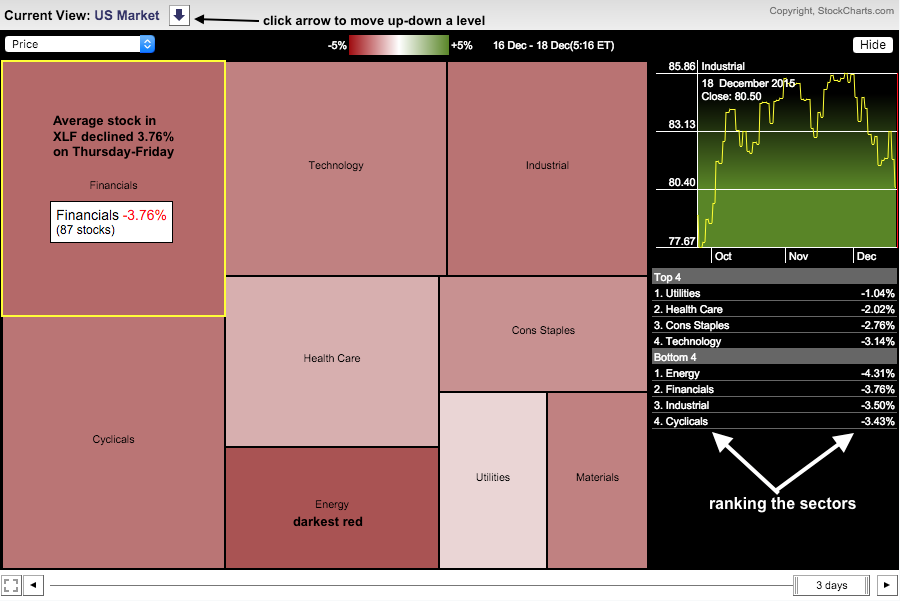
Stocks were hit hard on Thursday and Friday with most closing down sharply. There were a few gainers amongst the carnage and chartists can use the MarketCarpet to find such stocks. First, note that the S&P 500 was down 3.26% on Thursday-Friday and down .34% for the week. This is because we saw a pop Monday-Tuesday-Wednesday and a drop on Thursday-Friday. The drop wiped out the pop as the index finished slightly lower for the week. Among the sectors, utilities held up the best as the average stock fell around 1% on Thursday-Friday. Healthcare was in second place with an average decline of 2% and consumer staples in third with an average decline of 2.76%. The average 2-day decline for the remaining six sectors was more than 3%. Chartist can see the average decline by using the Sector PerfChart and viewing at the sector level. Click the arrow at the top left to move up-down a level. A downward pointing arrow shows the sector as a whole with the average change in the table on the right. All sectors were red with energy the reddest (biggest loss).
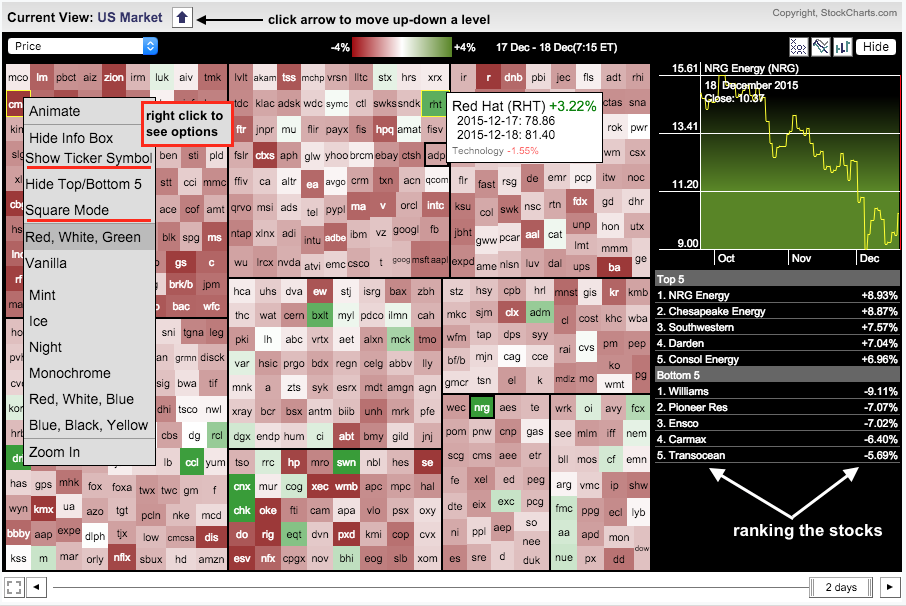
If we click the arrow to point up, we can see more detail with individual stocks. I also right clicked on the mouse to choose "show ticker symbol" and "square mode". Now we see some green boxes highlighting stocks that gained on Thursday-Friday, of which there were just 22. The table on the right shows the top five gainers. Looks like some oversold energy stocks got bounces within bigger downtrends. Alcoa (AA) held up well and finished with a small gain. Other stocks of note include AEE, BXLT, CCL, MCK and DGX.
****************************************
Thanks for tuning in and have a good day!
--Arthur Hill CMT
Plan your Trade and Trade your Plan
*****************************************


