Conditions changed on Friday and the short-term market prospects grew significantly riskier. Why? Because in addition to price support breakdowns across many key indices, sectors and industry groups, the volatility index ($VIX) spiked 26% on Friday to close at 24.39. Historically, the 20 level on the VIX has carried some rather meaningful implications. This is a simplistic view, but take a look what the VIX above 20 has meant in the past to S&P 500 performance:
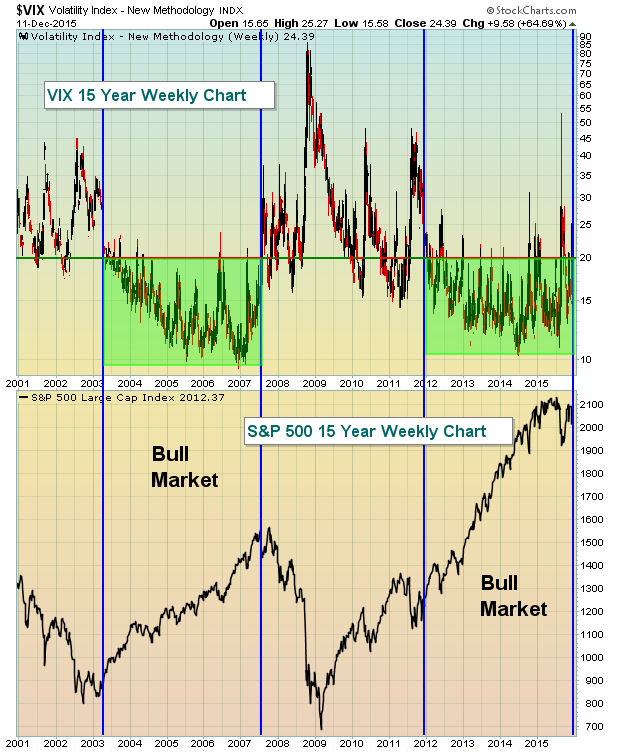
When volatility remains below 20 with only an occasional quick spike above 20, bull markets rage on. But when the VIX moves above 20, it's important that the bulls quickly regain control of the action and send the VIX back down beneath 20. I view the VIX as a tool to determine whether conditions are ripe for a "market tornado". A surge above 20 tells us that market participants are anticipating higher volatility ahead and that usually means lower equity prices - just like we saw on Friday. One tell tale sign of where the S&P 500 is heading will be how the market reacts this week to a VIX above 20. Impulsive bouts of selling almost always accompany high volatility and we're likely to face more of it as we begin a new trading week. Be careful.
Happy trading!
Tom