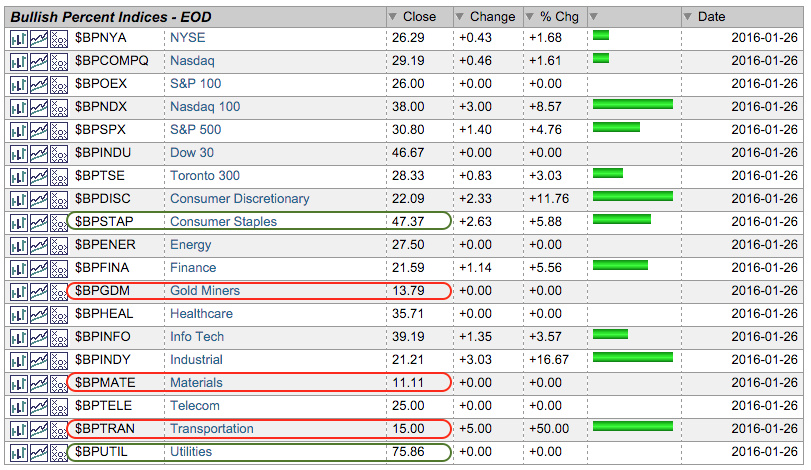
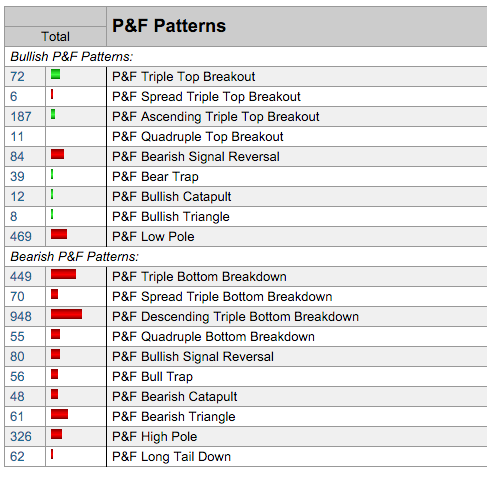
The selling pressure this year was broad enough to push all but one of the Bullish Percent Indexes below 50%, and most below 30%. Note that StockCharts tracks the Bullish Percent Index (BPI) for the ten sectors, several broad market indexes and the Gold Miners Index. The image below comes from the Market Summary page and you will find this BPI table at the bottom. BPI shows the percentage of stocks on a P&F buy signal, which is a double top breakout. A stock is either on a P&F buy signal or a P&F sell signal. There is no ambiguity in P&F land. Currently, the utilities sector has the highest percentage of buy signals with 75.86%. Consumer staples is the next closest at 47.37% and the Dow Industrials is hovering in the 47% area. Materials, gold miners and transports are the three weakest groups with BPIs below 20%. I will show some P&F signal examples after the jump.
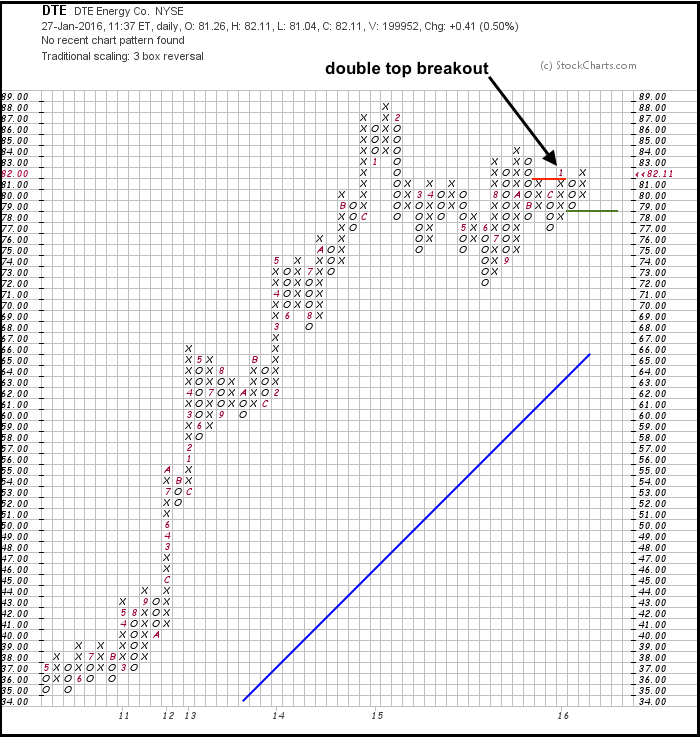
The chart below shows DTE Energy for an example of a P&F buy signal. The red "1" at the upper right of the chart shows a double top breakout because this X-Column exceeded the prior X-Column. The red "1" signals the start of January. DTE will remain on a P&F buy signal until it is countered with a P&F sell signal. A move below 79 would exceed the low of the prior X-Column and trigger such a signal.
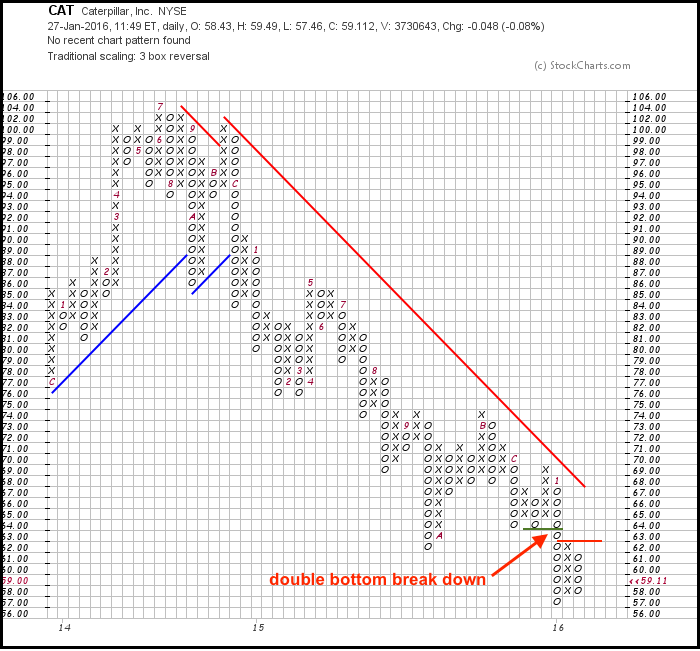
 The chart below shows Caterpillar (CAT) with an example of a P&F sell signal. Notice that the O-Column with the red "1" at the top broke below the prior O-Column. This triggered a double bottom breakdown or P&F sell signal. Actually, it was also a triple bottom breakdown. CAT will remain on this P&F sell signal until it is countered with a P&F buy signal, which occurs when the X-Column exceeds the high of the prior X-Column. This would require a move above 63.
 You can also track P&F signals at the bottom of our pre-defined scans page.
 ****************************************
Thanks for tuning in and have a good day!
--Arthur Hill CMT
Plan your Trade and Trade your Plan
*****************************************


