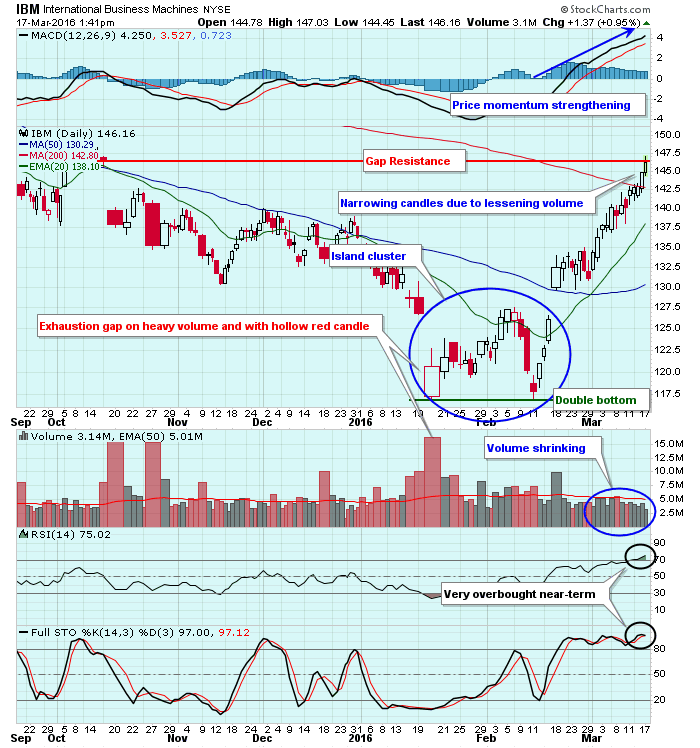
IBM had been under intense selling pressure and had lost more than 40% of its market cap from its March 2013 high to its early 2016 double bottom low near 117.00. Was that enough? Has it bottomed? Well, there was an exhaustion gap in mid-January followed by a double bottom and island cluster reversal in February. The ensuing rally has sent IBM up to test a key gap resistance level as its momentum oscillators have reached very overbought levels. Check it out:
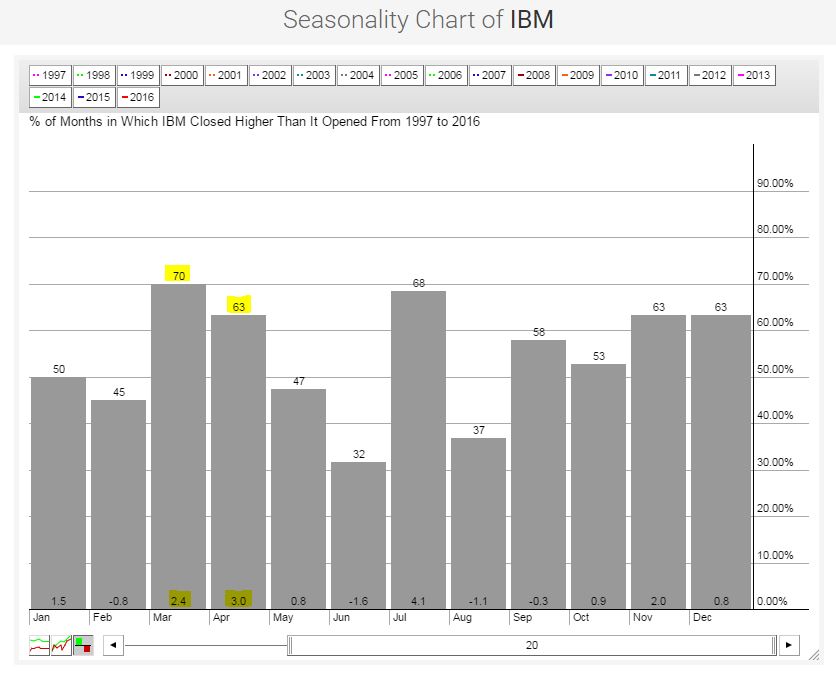
 The lighter volume to test gap resistance has resulted in thinner candles as I've used a CandleVolume chart rather than just plain candlesticks. The width of the candlestick is directly proportional to the amount of volume that particular day. IBM has become short-term overbought as it tests overhead gap resistance, but there is potentially good news ahead. Arthur Hill yesterday wrote about S&P 500 seasonal patterns showing that March and April have produced historically bullish results over the past twenty years. Below is a look at the seasonal pattern for IBM over the past twenty years:
 The yellow highlighted areas show that IBM also performs exceptionally well during the months of March and April, perhaps providing the boost necessary to clear overhead gap resistance in time.
Happy trading!
Tom


