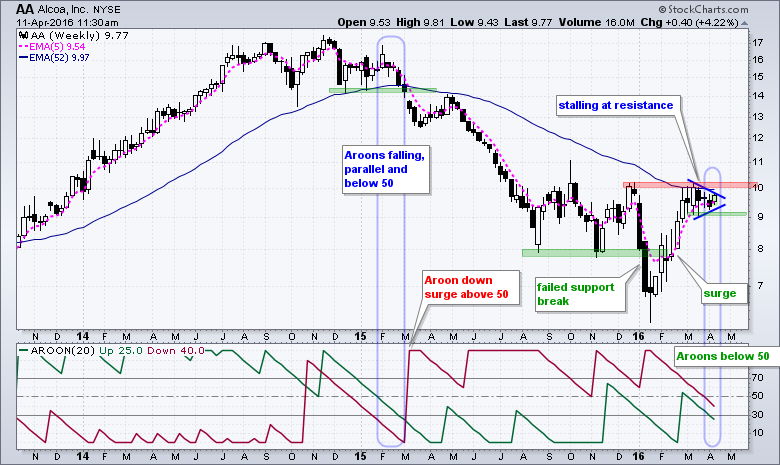
Alcoa (AA) kicks off first quarter earnings with its report today after the market close. I have no idea about earnings or how the stock will react, but price is at a most interesting juncture as a consolidation takes place just below resistance. This weekly candlestick chart shows AA breaking support in January and quickly recovering with a surge back above the break in February (bear trap). The stock surged all the way to resistance from the December highs and then stalled with a pennant like formation the last four weeks. A move above the red resistance zone would trigger a breakout and be quite bullish. Such a move would also break the flattening 52-week EMA and may even push the 5-week EMA above the 52-week EMA. Until we see an upside breakout, the big trend on the weekly chart is down and a support break at 9 would be short-term bearish.
The indicator window shows the Aroon indicators falling below 50 in a parallel fashion. This parallel decline below 50 reflects a stalemate between upward price movement (Aroon green) and downward price movement (Aroon red). The first one to turn up and break above 50 will trigger the next directional signal. Notice that both fell below 50 in February and Aroon Down (red) surged above 50 to trigger a bearish signal. This signal coincided with a support break on the price chart.
****************************************
Thanks for tuning in and have a good day!
--Arthur Hill CMT
Plan your Trade and Trade your Plan
*****************************************


