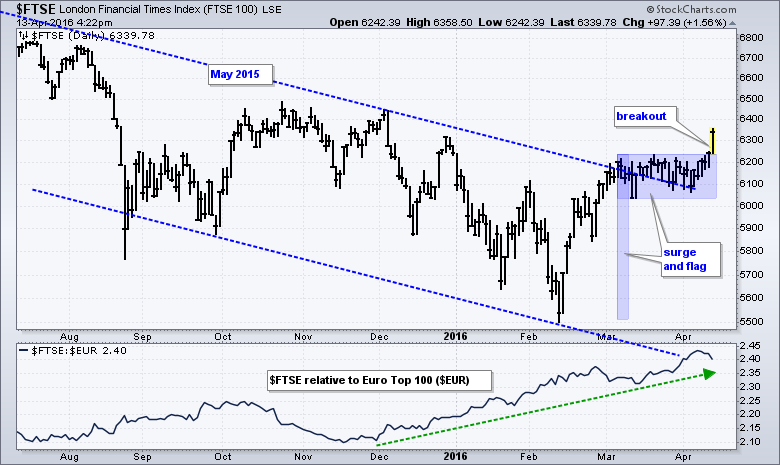
Today's stock market rally started in Asia, extended into Europe and carried through to the US this morning. The major European indices were sharply higher with the London FTSE ($FTSE) leading the charge. On the price chart, the FSTE surged to a trend line extending down from May 2015 and consolidated in the 6100-6200 area for five weeks. This consolidation looks like a flag and this is a bullish continuation pattern. The flag breakout signals a continuation of the February surge and solidifies the trend line breakout.
The indicator window shows the FTSE relative to the Eurotop 100 ($EUR) using the price relative ($FTSE:$EUR). This ratio has been rising since late November as UK stocks outperform the rest of Europe. Brexit be damned!
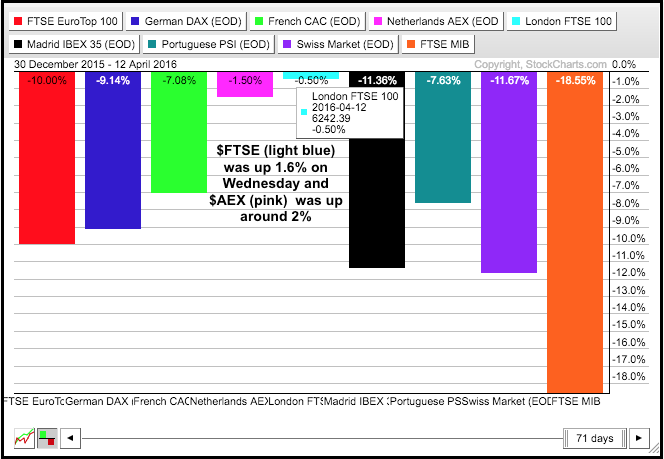
The PerfChart below shows year-to-date performance for the FTSE and eight other European indices. It does not, however, include today's big advance. With today's 1.6% advance, the FTSE turned positive year-to-date. The Netherlands AEX is up over 2% in late trading on Wednesday and also poised to turn positive year-to-date. Even with a big advance today, the other seven will remain negative year-to-date and lagging.
 ****************************************
Thanks for tuning in and have a good day!
--Arthur Hill CMT
Plan your Trade and Trade your Plan
*****************************************


