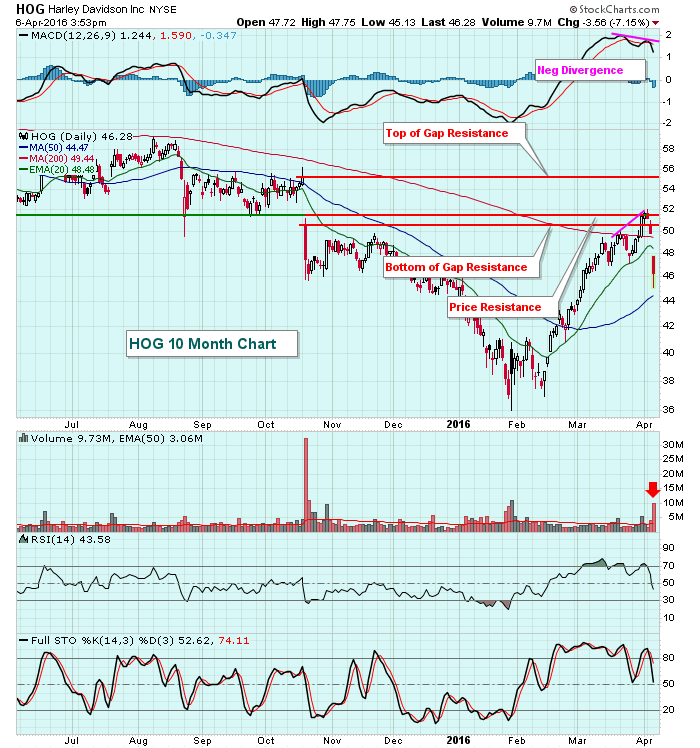
Volume is triple its normal daily volume and Harley Davidson (HOG) is down more than 7% today, but technical analysis flashed many warning signs on both the daily and weekly charts. First, let's look at the daily chart where price and gap resistance and a negative divergence all suggested HOG reached a pivotal level and possibly a top:
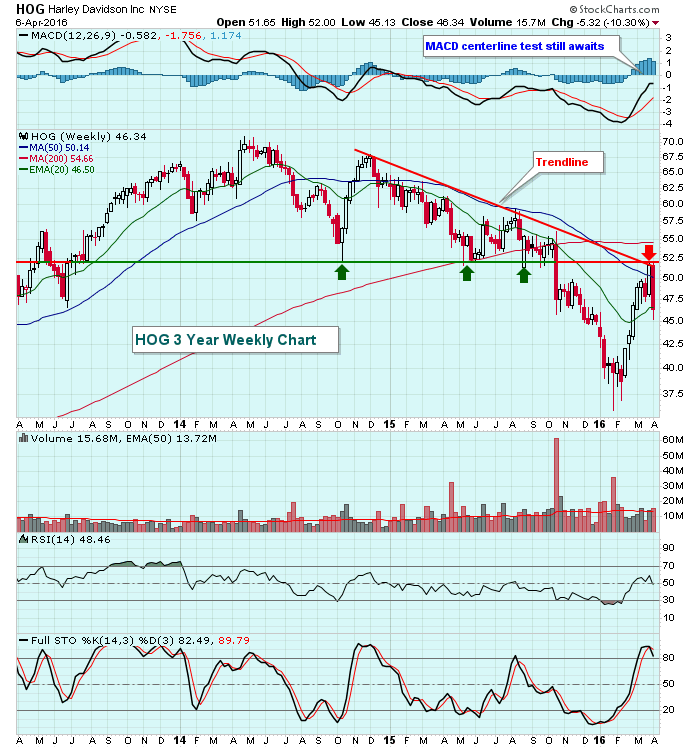
 Furthermore, the weekly chart shows a clear downtrend in play over the past couple years and that was just tested as well:
 HOG simply appears to be out of gas.
Happy trading!
Tom

About the author:
Tom Bowley is the Chief Market Strategist of EarningsBeats.com, a company providing a research and educational platform for both investment professionals and individual investors. Tom writes a comprehensive Daily Market Report (DMR), providing guidance to EB.com members every day that the stock market is open. Tom has contributed technical expertise here at StockCharts.com since 2006 and has a fundamental background in public accounting as well, blending a unique skill set to approach the U.S. stock market.
Learn More


