The Semiconductor SPDR (XSD) is one the leading industry-group ETFs at midday on Monday with a gain of around 2%. A look at the chart shows this big gain coming at a potential support or reversal zone. First, notice that XSD broke resistance with a big move in February. Broken resistance turns into potential support in the 41.50 area. Second, the April-May decline retraced around 50% of the February-March advance. This is a typical retracement for correction within a bigger uptrend. Third, notice that the 200-day moving average is around 41.3 and fits into this support-reversal zone.
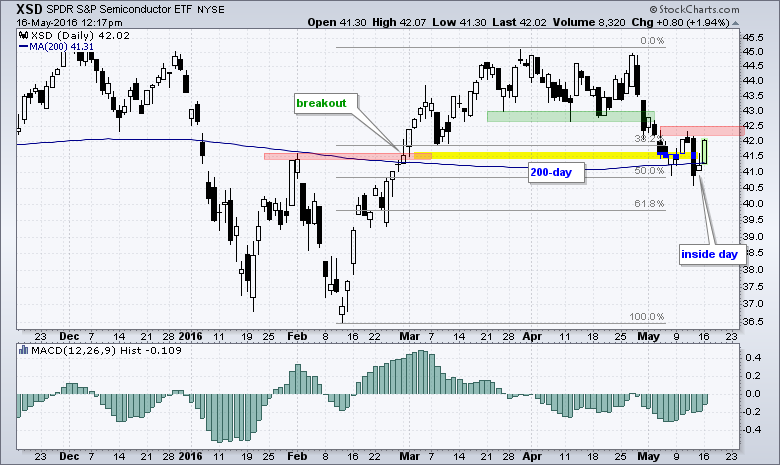
The short-term trend, however, remains down. XSD fell sharply last Thursday and then firmed on Friday to form an inside day. This shows indecision that can lead to a short-term reversal. Last week's high marks first resistance in the 42.3-42.5 area. A breakout here would reverse the three week slide and suggest that the bigger uptrend is resuming. The indicator window shows the MACD Histogram, which measures the distance between MACD and its signal line. A move into positive territory would signal that MACD has crossed above its signal line. â
****************************************
Thanks for tuning in and have a great day!
--Arthur Hill CMT
Plan your Trade and Trade your Plan
*****************************************


