SunTrust Banks (STI) looks very bullish on a longer-term weekly chart, awaiting a critical technical breakout. But on its daily chart, there are signs of slowing momentum and overbought conditions as price resistance nears. So what's a trader to do? Well, let's look at the two charts beginning with the big picture:
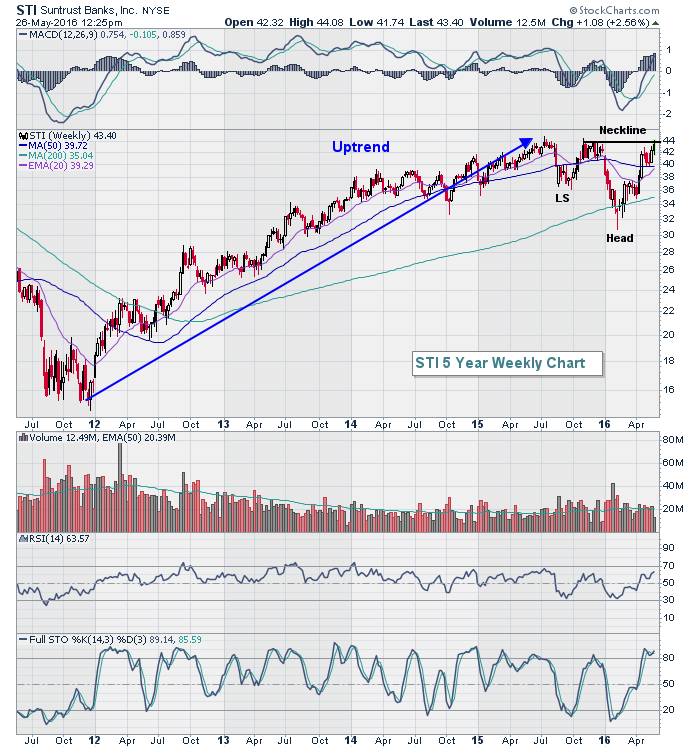 The longer-term pattern is a very bullish inverse head & shoulders pattern that would fully develop on a pull back from the current price level. The pattern would then confirm on a high volume breakout above 44.00-44.50. Given that longer-term backdrop, let's now look at the shorter-term view:
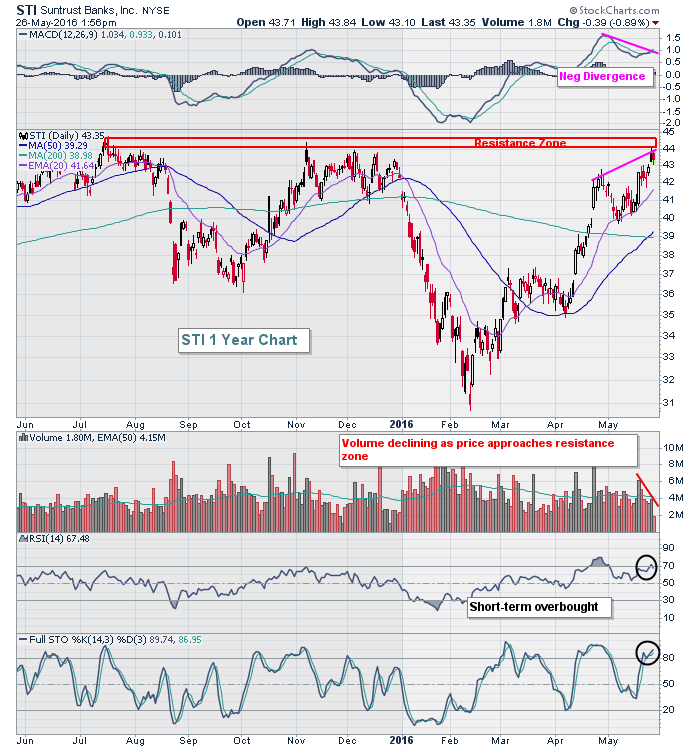 The daily chart is overbought and shows slowing momentum in terms of price action (negative divergence) and declining volume. I'd be a short-term seller of STI in the 44.00-44.50 area, but a buyer if we see a 50 day SMA test to reset the MACD because of the longer-term bullish pattern. A 50 day SMA test would form the inverse right shoulder on the weekly chart.
Banks in general look very bullish to me and a chart of the DJUSBK was featured in the Sector/Industry Watch section of my Trading Places blog earlier today. If you'd like to see that chart, CLICK HERE and scroll down.
Happy trading!
Tom


