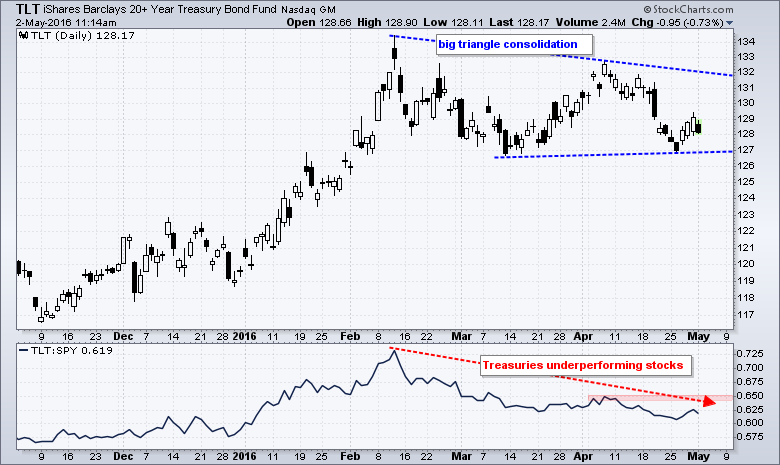
The first week of the month is always a big week for Treasury bonds and the 20+ YR T-Bond ETF (TLT). There are always a slew of key economic reports and the employment report is usually the first Friday of the month. I am not going to get into the economic quicksand, but I will take a stab at the price chart for TLT. First, the bigger picture shows a steep advance from late December to early February and a large triangle consolidation. A consolidation is usually a continuation pattern and this means a breakout near 132 would signal a continuation of the prior advance. Triangles don't always mark continuations so we also have to watch support in the 127 area for a break down. There are also some short-term patterns at work and I will cover these after the jump.
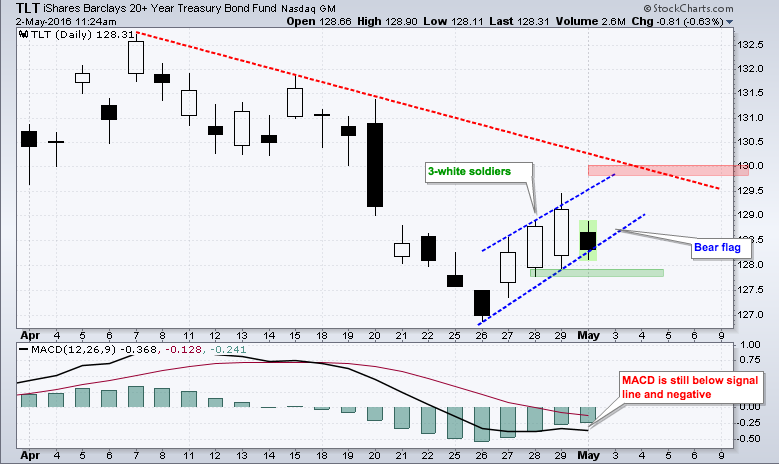
 The next chart focuses on the short-term. Notice that TLT surged on Wednesday, Thursday and Friday to form a three white soldiers pattern. The open of the second candlestick is below the close of the first and the open of the third is below the close of the second. This means TLT opened weak and closed strong those two days. Technically, the three white soldiers is short-term bullish and confirmation is not required. I would note, however, that TLT remains below the April trend line and MACD is still negative. A little follow through is needed to reverse the four week downtrend. I am also watching a potential bear flag (blue trend lines). This represents a small counter-trend bounce and a break below Thursday's low (127.7) would be bearish. Chartists should watch TLT for clues on the S&P 500 because there is a negative correlation between the two.
****************************************
Thanks for tuning in and have a great day!
--Arthur Hill CMT
Plan your Trade and Trade your Plan
*****************************************


