Boeing has been stuck in a trading range since late March and signs of accumulation suggest an upside breakout. On the price chart, notice that BA surged from the 102 area to 135 from mid February to mid March. The stock was certainly entitled to a consolidation after a 30+ percent advance. The 200-day moving average flattened in the middle of this consolidation and the 50-day moving average is also near the middle and flattening. It looks like Boeing is gearing up for a move here. But which way?
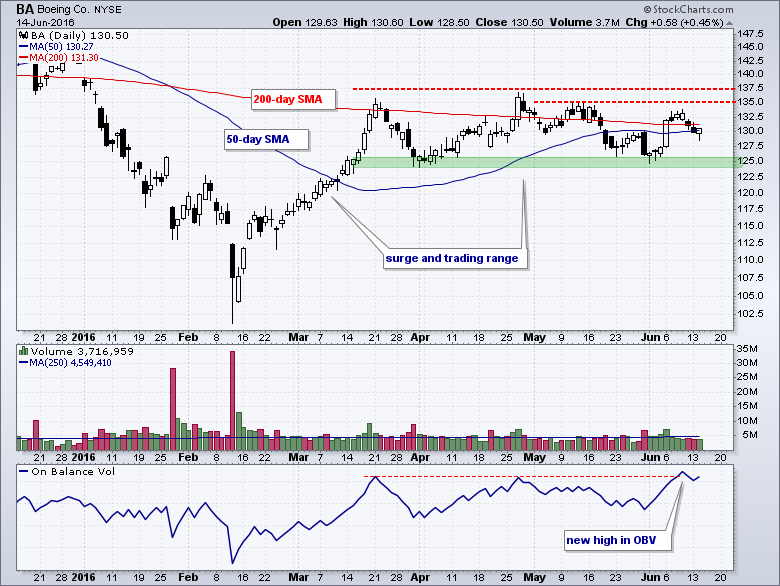
I added volume and On Balance Volume (OBV) as indicators. Upside volume has been fairly robust since mid February and On Balance Volume (OBV) hit a new high last week. On Balance Volume is a cumulative indicator that adds volume on up days and subtracts it on down days. The new high in OBV suggests that upside volume is outpacing downside volume and this points to accumulation within the trading range. Accumulation increases the chances of an upside breakout. Returning to the price chart, chartists can look for a close above the May high (135) and a bullish moving average crossover to turn bullish on Boeing.
****************************************
Thanks for tuning in and have a great day!
--Arthur Hill CMT
Plan your Trade and Trade your Plan
*****************************************


