Devry, Inc. (DV) topped at close to 50.00 during the fourth quarter of 2014 and it has spent the last 18 months declining steadily until reaching what now appears to be a bottom just above 15.00. A positive divergence has emerged on its weekly MACD and volume trends also appear to have turned a corner and are now more bullish. Check out the chart:
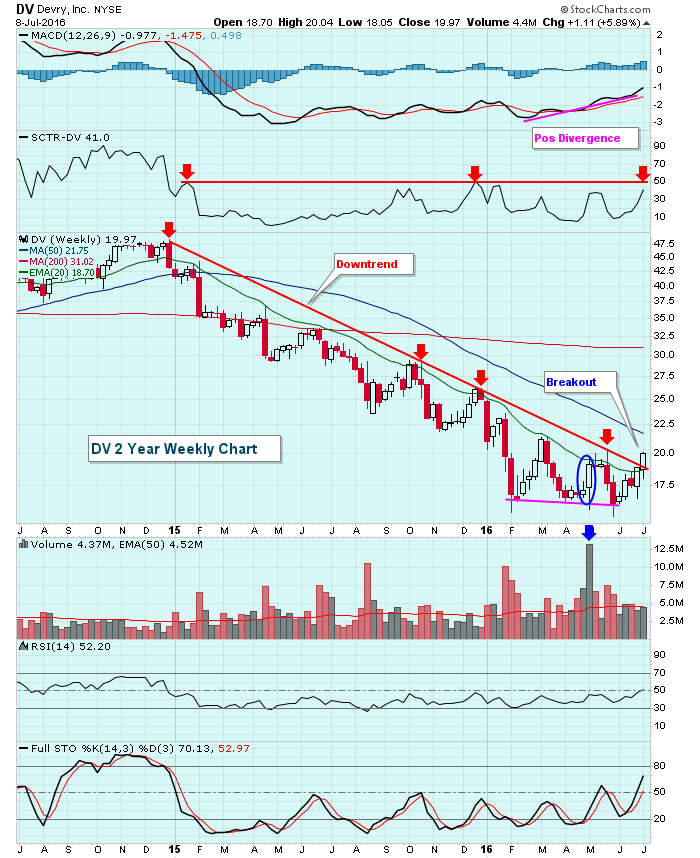 DV has had consecutive weekly closes above its 20 week EMA for the first time since the downtrend began. Volume trends are improving and a SCTR break above 50 would likely signal the worst is behind this educational company. Given the positive divergence, I'd initially look for a 50 week SMA test to reset its weekly MACD back to its zero line.
Happy trading!
Tom

About the author:
Tom Bowley is the Chief Market Strategist of EarningsBeats.com, a company providing a research and educational platform for both investment professionals and individual investors. Tom writes a comprehensive Daily Market Report (DMR), providing guidance to EB.com members every day that the stock market is open. Tom has contributed technical expertise here at StockCharts.com since 2006 and has a fundamental background in public accounting as well, blending a unique skill set to approach the U.S. stock market.
Learn More


