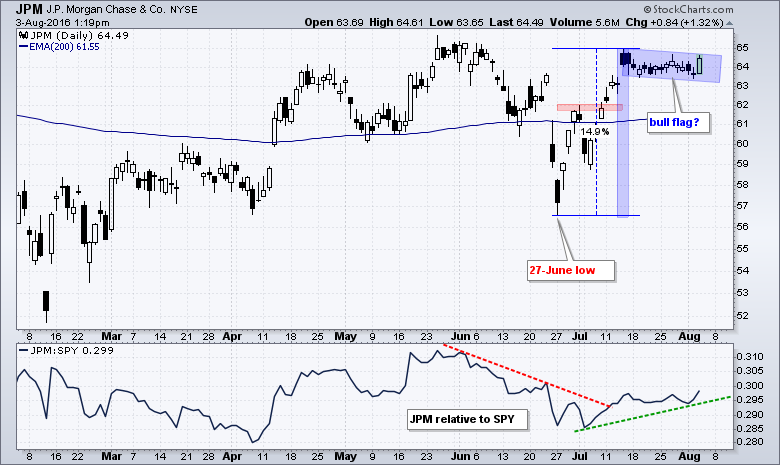
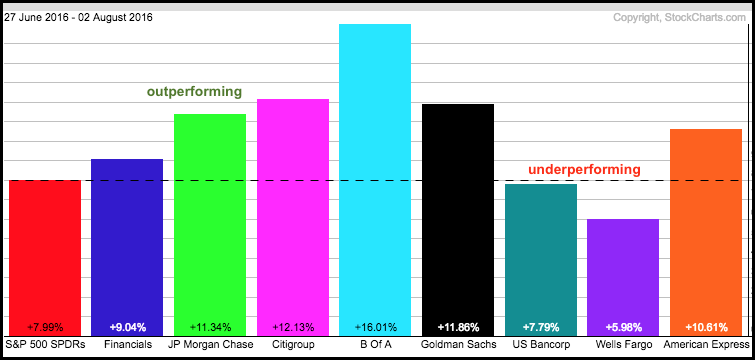
One would not think it from the price charts, but the Finance SPDR (XLF) and several banking stocks are outperforming the S&P 500 SPDR (SPY) since late June. XLF, KRE and many banking stocks are trading below their spring highs and SPY is trading near a 52-week high. The PerfChart below shows the performance for SPY, XLF and seven banking stocks from 27-June to 2-Aug. I chose 27-June for the starting point because this is when the most recent leg up started. Notice that XLF is up more than SPY and five of the seven stocks are up more than SPY. These stocks are outperforming the broader market and this is encouraging for the finance sector. I will show JP Morgan with a potential bull flag after the jump.
JPM is leading the market with big move on Wednesday as a bull flag take shape the last few weeks. The stock broke below the 200-day EMA in late June, but surged back above this key moving average in July. After surging some 15%, the stock was short-term overbought and ripe for a correction. A flat represents a correction and it is a bullish continuation pattern. A break above flag resistance, therefore, would end the correction and signal a continuation of the prior advance. Failure to break out and a move below 63 would negate this bull flag and call for a re-evaluation.
 ****************************************
Thanks for tuning in and have a great day!
--Arthur Hill CMT
Plan your Trade and Trade your Plan
*****************************************


