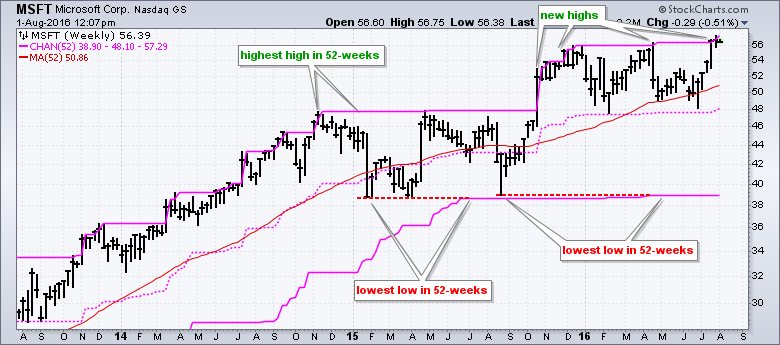
Chartists can plot 52-week highs right on the price chart by using the Price Channels overlay. The upper line of a 52-week Price Channel marks the high of the last 52-weeks, the lower line marks the low and the middle line is the average of the two. By plotting this indicator on the price chart, chartists can immediately see when a stock records a 52-week high or low. In addition, chartists can see how far a stock is from a 52-week high (or low). The chart below shows Microsoft (MSFT) with weekly bars and the 52-period Price Channel. Notice that the stock recorded 52-week highs throughout 2014, did not record a 52-week low in 2015 and resumed its 52-week high steak in October 2015. 52-week highs are bullish and only occur in uptrends. After the jump I will look at daily chart for Tractor Supply (TSCO) as it pulls back from a yearly high.
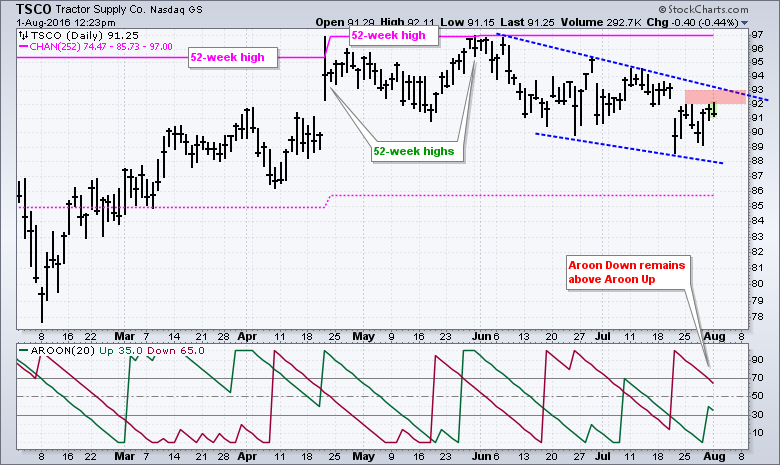
TSCO hit a 252-day high in April and again in late May. 252 trading days is about a year and this represents a 52-week high. The stock pulled back over the last two months and remains within a falling wedge. This is interesting because the 252-day high suggests a bigger uptrend and this decline may be just a pullback within this bigger uptrend. Most recently, TCSO gapped down on 21-July and has yet to fill this gap. A close above 93 would break the wedge trend line and fill the gap. This could suggest that the pullback is ending and the bigger uptrend is resuming. Chartists can also watch for Aroon Up to cross Aroon Down and hit 100 for a bullish signal.
 ****************************************
Thanks for tuning in and have a great day!
--Arthur Hill CMT
Plan your Trade and Trade your Plan
*****************************************


