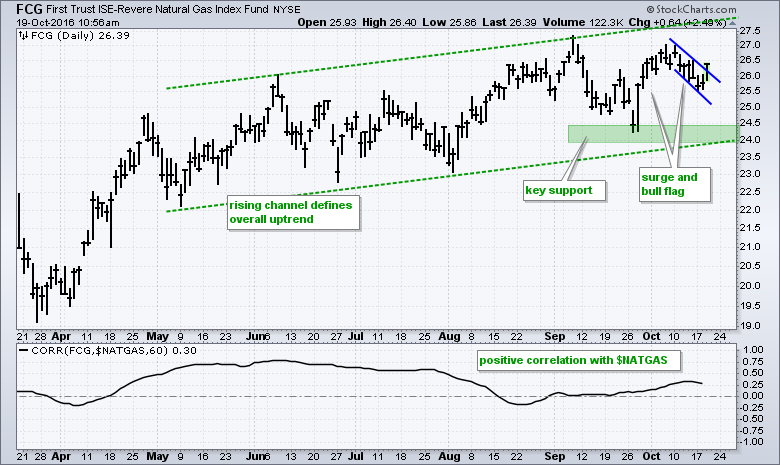
The FirstTrust Natural Gas ETF (FCG) has been one of the top performing ETFs this year with a year-to-date gain of around 18%. As the chart below shows, the overall trend is clearly up and the ETF is forming a small bullish continuation pattern. First, a rising channel defines the uptrend with a series of rising peaks and rising troughs. Even though the early October high did not exceed the early September high, the ETF remains well within the channel and well above the prior low. The September low and lower trend line combine to mark key support in the 24-24.5 area.
Short-term, the ETF surged around 9% from late September to early October and then pulled back over the last two weeks with a falling flag. Flags are continuation patterns that mark small corrections. For example, a falling flag slopes down as price retraces a portion of the prior advance. FCG is surging above flag resistance today and this is bullish. It signals a continuation of the prior 9% surge and targets a move towards the upper channel trend line. Chartists can use this week's low to mark first support. The indicator window shows the Correlation Coefficient ($NATGAS, FCG) in positive territory for the most part. This means NatGas and FCG tend to move in the same direction. I covered NatGas in Tuesday's webinar by highlighting a recent breakout and marking key support.
****************************************
Thanks for tuning in and have a great day!
--Arthur Hill CMT
Plan your Trade and Trade your Plan
*****************************************


