There are fundamental, technical and historical factors that drive U.S. equity prices. Earnings and interest rates have very clear fundamental impacts. The Fed has done everything in their power to keep interest rates at historically low levels in an attempt to promote growth. We could debate back and forth how successful they've been. I would argue that the low rates and cheap money have absolutely been beneficial to the bottom lines of Corporate America, but rates could be at the beginning stages of an extended advance. That's where technical indicators come into play. Big investment firms talk to management teams about how their quarters are progressing and invest their own and clients' money accordingly. That demand vs. supply shows up on the charts and astute technicians pay attention not only to the money pouring into equity markets, but also where that money is flowing. If market participants are truly bullish about the fortunes of the U.S. economy, they'll want to be invested in aggressive (vs. defensive) areas of the market. I follow a few key ratios to determine how bullish traders truly are. If bullish, we should see these relative ratios rising. Check out the 10 year monthly chart of the S&P 500 with three key ratios plotted beneath the price action:
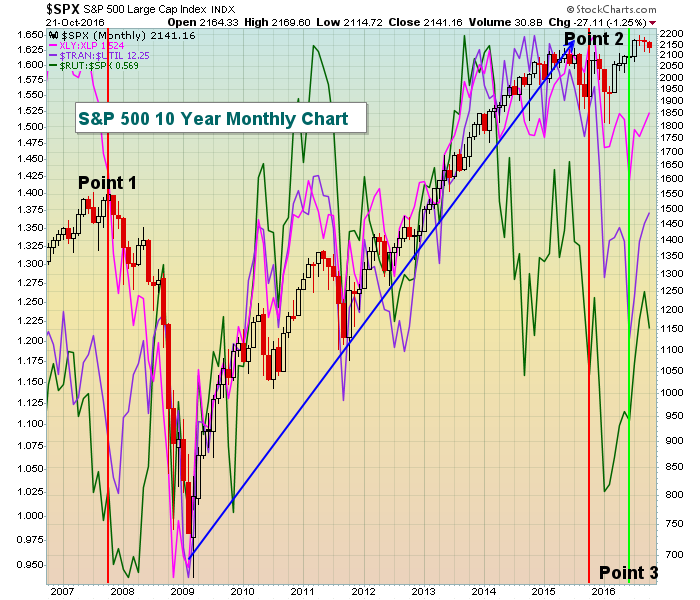 This may look like a really busy chart and it is. But there are really key points to be made here. First, refer to "Point 1" above and the vertical line shown. At the 2007 bull market high, two of the three relative ratios that I follow turned much, much lower. This is indicative of money flowing away from key aggressive areas of the market. It's a form of a negative divergence in my view - in that prices are telling us to be bullish but money is rotating towards defense. Why would anyone want to be more defensive as the S&P 500 is hitting an all-time high? Well, CNBC was touting the S&P 500 at all-time highs while big money was growing much more defensive. I didn't need a PhD in Economics to figure out that I shouldn't trust the stock market then. The bear market that ensued was one of the worst on record. Now fast forward to the clear uptrend (blue line and arrow pointing higher) that took place during the current bull market. As the S&P 500 rose, money rotated towards offense as those rising relative trendlines tell us. At "Point 2", the "under the surface" message began to change. Actually, the Russell 2000 vs. S&P 500 ($RUT:$SPX) ratio had already begun to falter. The other two key ratios did manage to remain near their relative highs though. At the end of 2015, all of the relative ratios turned lower and I've been very cautiously bullish ever since. The primary reason I've stayed bullish at all is that my primary technical indicator - price/volume combination - has remained bullish. We're still in a long-term uptrend and that won't change unless the S&P 500 loses, at a minimum, short-term price support at 2120.
Also bullish is the fact that post-Brexit, these relative ratios are again turning higher to confirm the S&P 500 breakout that occurred in July ("Point 3"). In other words, money has been rotating towards aggressive areas of the market although all are still well below the highs established over the past couple years. In order to believe in the continuation of this 7 1/2 year bull market, I need to see two things. First, I want to see the S&P 500 clear 2190 on a closing basis and, second, I want to see these relative ratios moving higher to confirm the price breakout.
Until then, my cautiously bullish forecast remains....
One last point, this time regarding historical tendencies. While the 2007 bear market began in October, it's generally unusual to see that. November through January is the best three consecutive month period in terms of equity performance during the year. And this S&P 500 data dates back to 1950, or 66 years. Therefore, the historical expectation would be for another breakout later this year - and a continuation of this bull market.
Happy trading!
Tom


