Applied Materials (AMAT) printed a shooting star candlestick on Thursday, with a long-term negative divergence in play on both its daily and weekly charts, signs of slowing momentum to the upside from both an intermediate- and long-term perspective. AMAT, just a few days ago, printed a reversing dark cloud cover candle, but still managed to clear that high with today's intraday high. But today's reversal and overall lighter volume of late suggests the near-term is dicey at best. Check out the chart:
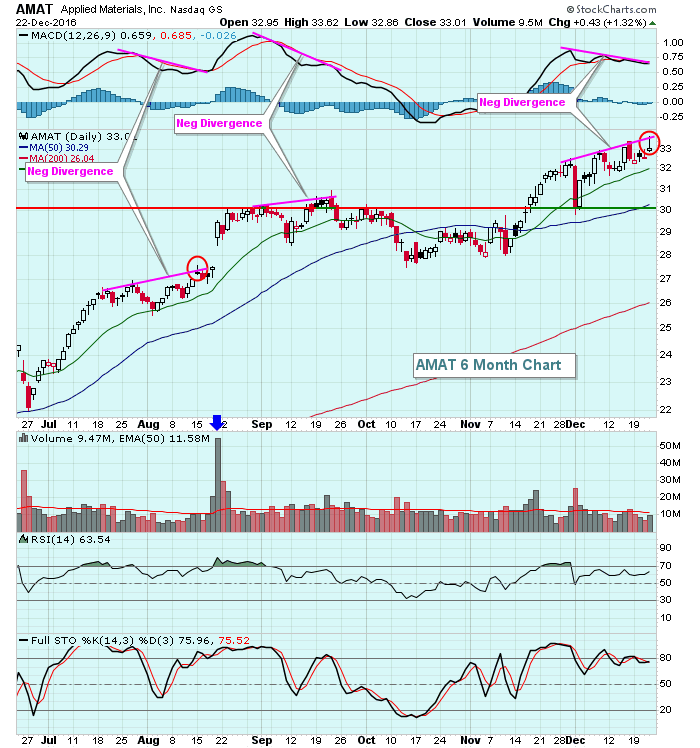 There have been three separate negative divergences on the AMAT chart over the past six months. The first did not work, but I throw out technical patterns when earnings are coming out and that was the reason AMAT shot higher after that first negative divergence printed. Volume was massive on the gap higher and the negative divergence was eliminated. The second negative divergence worked as AMAT retreated 10% or so to unwind its momentum oscillators.
Will this third negative divergence work? Well, earnings won't be out again for AMAT until mid-February so I'd expect slowing momentum to be a concern for the next few weeks. If we do see AMAT print higher prices, check the volume. Unless the volume is well above average volume, I wouldn't trust the advance.
Happy trading!
Tom


