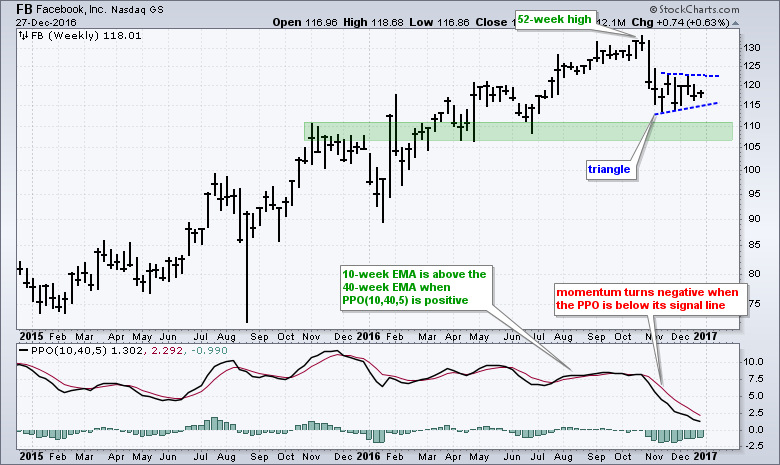
The Nasdaq 100 ETF and S&P 500 SPDR hit new highs in mid December, but Facebook (FB) did not partake in these new highs and remains stuck in a consolidation. Even though relative weakness since late October is negative, the stock remains in a long-term uptrend and we are in a bull market. The uptrend and bull market carry more weight, in my humble opinion. On the price chart, I am watching the small triangle that formed over the last six weeks. A downside break at 115 would be bearish and target a move into the green support zone. An upside breakout at 123 would be bullish and suggest a continuation of the bigger uptrend.
The indicator window shows the PPO(10,40,5). The black line is the percentage difference between the 10-week EMA and the 40-week EMA. It is positive when the 10-week EMA is above the 40-week EMA. Note that the PPO has been positive since July 2013 and this affirms the overall uptrend for Facebook.
Momentum within this trend is another story. Momentum is bullish when the PPO is rising and above its signal line, which is the 5-week EMA of the PPO. Momentum is negative when the PPO is falling and below its signal line. Thus, even though the PPO is positive and the big trend is up, shorter-term momentum is negative and continuing to weaken. The PPO needs to cross back above its signal line for momentum to turn bullish again.
****************************************
Thanks for tuning in and have a great day!
--Arthur Hill CMT
Plan your Trade and Trade your Plan
*****************************************


