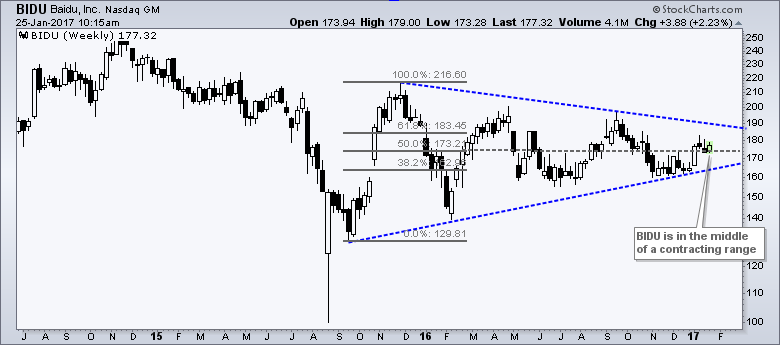
Baidu (BIDU) has gone nowhere for a year as a large triangle pattern formed on the weekly chart. There are, however, signs of support and a short-term bullish pattern is emerging on the daily chart. First, the weekly chart shows a triangle that extends from around 120 to 218 at the widest point in late 2015. The range consistently narrowed throughout 2016 and extended from 162 to 198 the last three months of 2016. The narrowing range tells us that volatility is contracting and chartists should be alert for a volatility expansion (big move).
Signs of support and a bullish pattern can be found on the daily chart. Baidu held above the summer lows (green support zone) and broke out with a surge in early January. Broken resistance turns first support in the 171-173 area. A strong breakout should hold so a close below 171 would suggest a breakout failure. A pullback to the breakout is normal and this is called a throwback. This pullback looks like a falling flag and this is a bullish continuation pattern. A breakout at 179.5 would be bullish and signal a continuation of the early January surge.
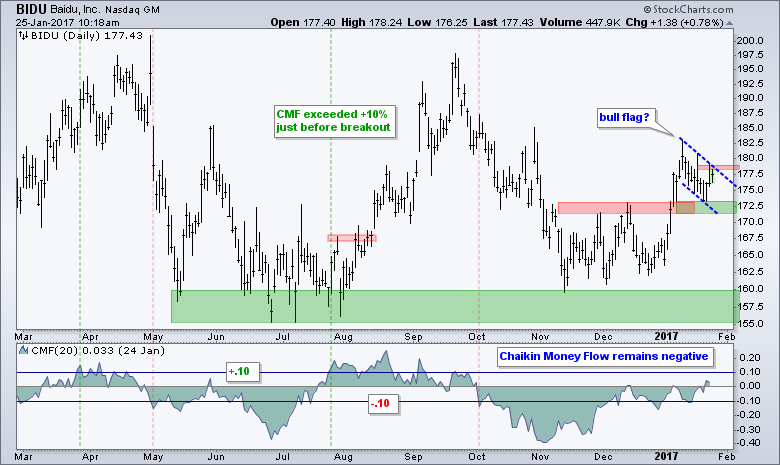 The indicator window shows Chaikin Money Flow (CMF), an indicator that combines volume and price action to measure accumulation and distribution. I set a bullish threshold at +10% and a bearish threshold at -10%. Keep in mind that CMF, and all indicators for that matter, is secondary to price. In other words, CMF is meant to enhance the analysis, not dictate it. CMF just edged above the zero line and further strengthening above +10% would show strong accumulation in the stock.
I would like to personally invite you to Chart Summit 2017, a virtual conference on Technical Analysis on January 27th and 28th. This FREE 2-day event will bring together a group of professional technicians who will walk you through their process and show you how to apply their methods in the current market environment. I will present a broad market and sector timing strategy using breadth indicators. I will be presenting on Saturday, January 28th, at 12PM ET.

****************************************
Thanks for tuning in and have a good weekend!
--Arthur Hill CMT
Plan your Trade and Trade your Plan
*****************************************
/p>


