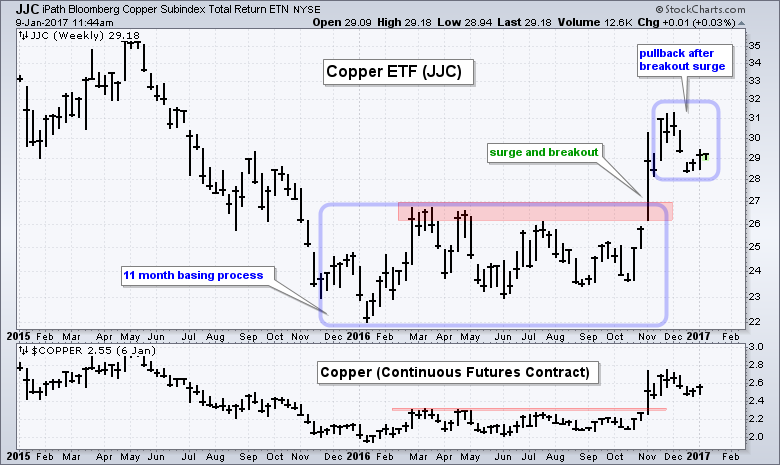
The Copper ETN (JJC) broke out with a big surge in October-November and then pulled back in December. This pullback looks like a normal correction after a big move and chartists should be alert for a continuation higher. The weekly chart shows JJC and the Copper Continuous Futures Contract ($COPPER) basing from November 2015 until October 2016 and then breaking base resistance with a strong move. This breakout move also pushed copper to a 52-week high, but created a short-term overbought condition that needed to be alleviated. Overbought conditions dissipate with a pullback, a flat consolidation or a little of both. JJC did indeed pull back in December and shows signs of firmness the last three weeks. We will look at the daily chart after the jump.
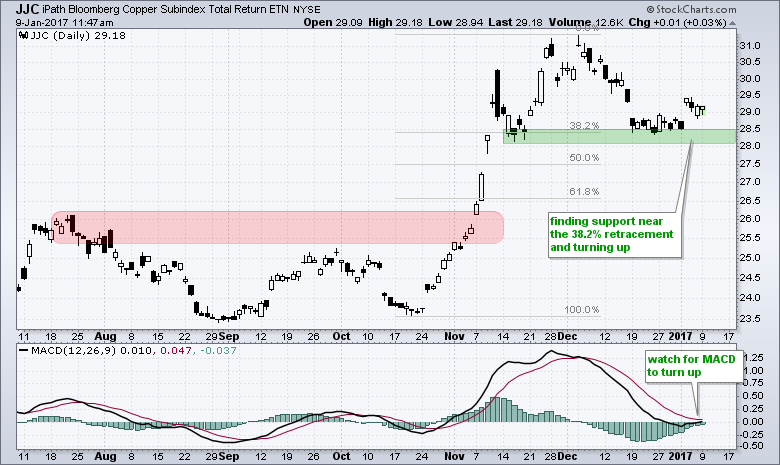
The daily chart shows JJC firming near the 38.2% retracement line. This is a relatively shallow retracement of the prior surge and is the minimum expected on a pullback. JJC held the 28.5 area the last two weeks of December and turned up with a move above 29 last week. The indicator window shows MACD flattening near the zero line and an edging higher. A break above the signal line would signal an upturn in momentum.
 ****************************************
Thanks for tuning in and have a great day!
--Arthur Hill CMT
Plan your Trade and Trade your Plan
*****************************************


