The Russell 2000 has been under selling pressure but is now testing key support on both its daily and weekly charts. There is a slight negative divergence that's present on its weekly chart, so that would be a signal of possible weakness ahead. The good news is that none of the other major indices have similar momentum issues on their longer-term weekly charts. Still, let's focus on the small caps and take a look at the support that's holding on the daily chart:
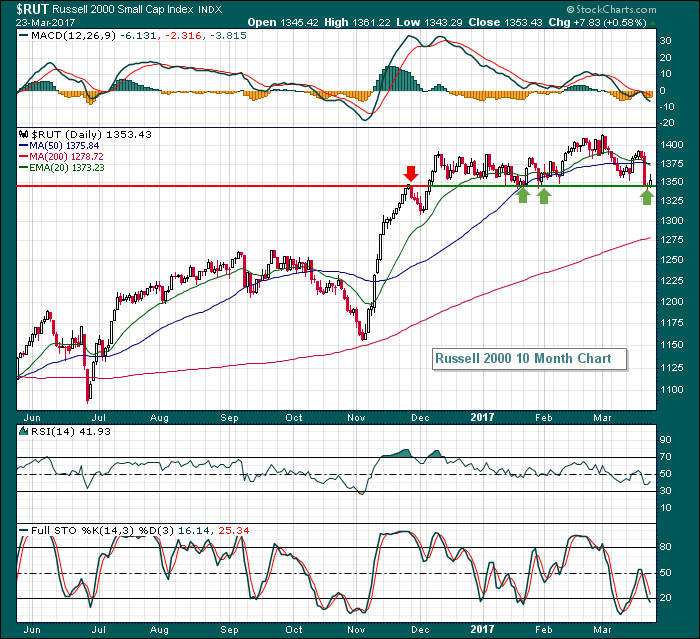 Thursday's rally occurred just in time here on the daily chart as support beneath 1350 held nicely. But the bigger issue could be slowing momentum on the weekly chart with 20 week EMA support being tested. Check this out:
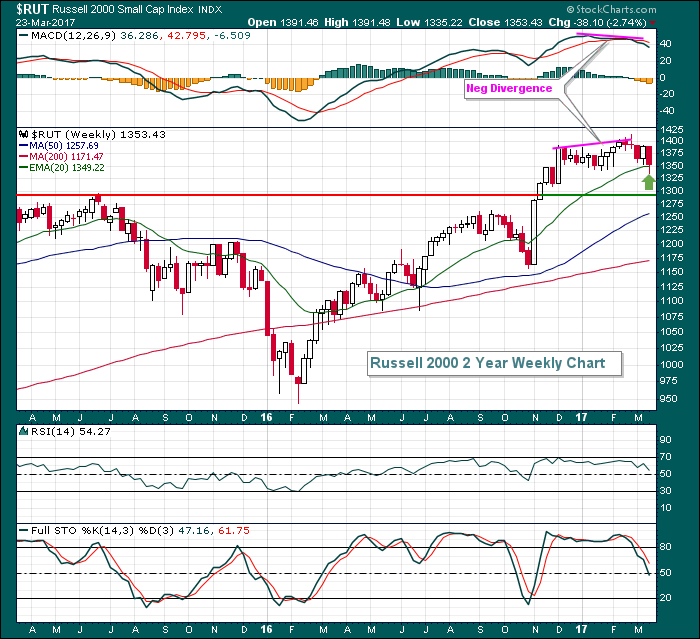 A close beneath the rising 20 week EMA would then begin to signal a much stronger likelihood of an extended move to the downside. I do find it helpful, however, that the other major indices show very strong momentum on their respective weekly charts.
Happy trading!
Tom


