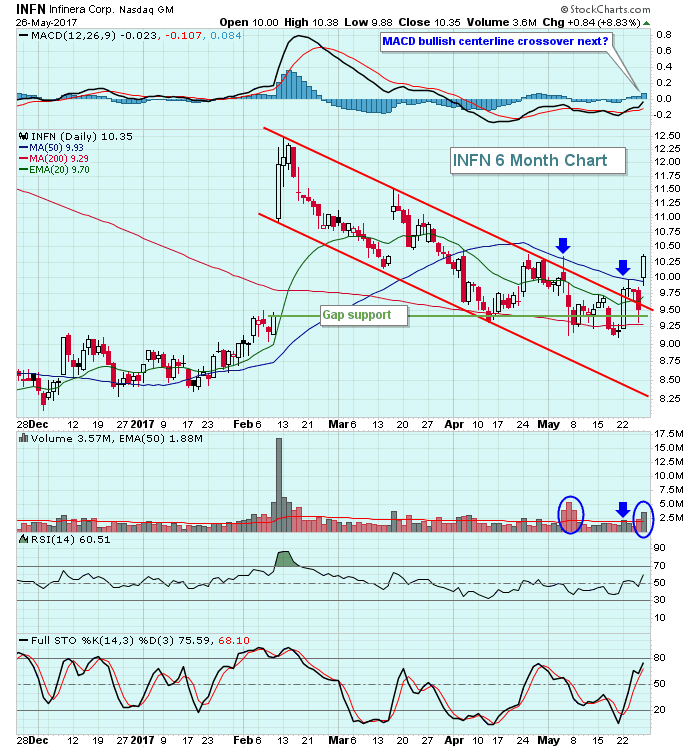
Infinera (INFN) gapped higher in February on massive volume, but has been falling in a descending channel ever since. Volume accelerated on Friday as INFN clearly broke this down channel. The reversal also is taking place after a key gap support level was filled and tested. Take a look at the chart:
The two blue arrows highlight the problems associated with the last two attempts at a trendline breakout. In the first case in early May, INFN showed heavy volume that accompanied a reversing candle and false breakout, a bearish signal. In the second attempt, note that the trendline was broken, but volume was average at best. On Friday, however, volume expanded as INFN easily broke its downtrend, arguing for higher prices in the near-term. A bullish MACD centerline crossover would be another technical signal to watch for.
If there's one problem with INFN, it's the longer-term weekly chart. Even after Friday's gap and near 9% gain, INFN remains 60% beneath where it was in August 2015.
Happy trading!
Tom


