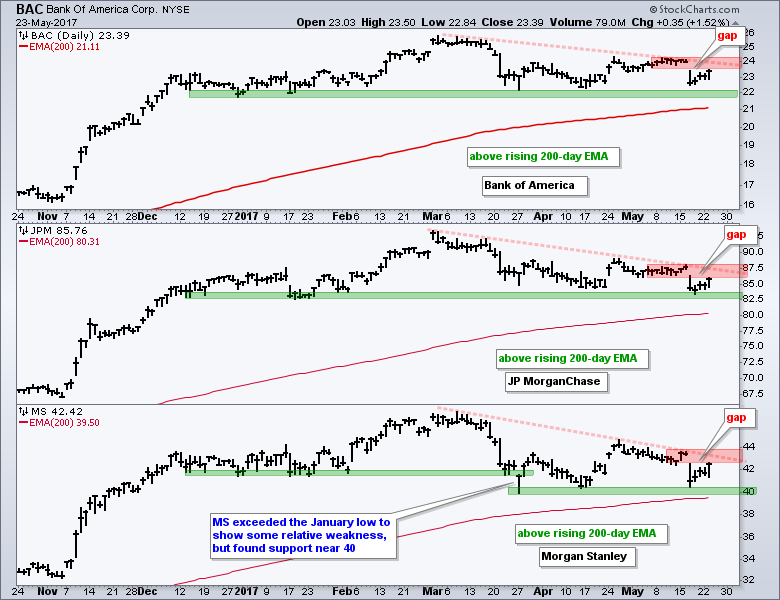
Banking stocks bounced on Tuesday as the 20+ YR T-Bond ETF (TLT) fell and the 10-yr T-Yield ($TNX) moved higher. These bounces reinforce the positive correlation with TLT and the negative correlation with $TNX. The chart below shows three big banks in long-term uptrends and six month stalls. Technically, Bank of America, JP MorganChase and Morgan Stanley are in long-term uptrends because they are above their rising 200-day EMAs and they hit new highs in March.
Despite uptrends, these three have traded flat since mid December and I am sure plenty of chartists see head-and-shoulders patterns taking shape with the green zones marking neckline support. I am more inclined to see downtrends since March (red trendlines) and I consider these corrections within a bigger uptrend. The big question is: when, if ever, will this correction end? The red zones mark the gaps and the mid May highs. A close above these levels would fill the gaps and break the first resistance level. This would reflect an increase in buying pressure and point to an end to the corrections.
****************************************
Thanks for tuning in and have a great day!
--Arthur Hill CMT
Plan your Trade and Trade your Plan
****************************************


