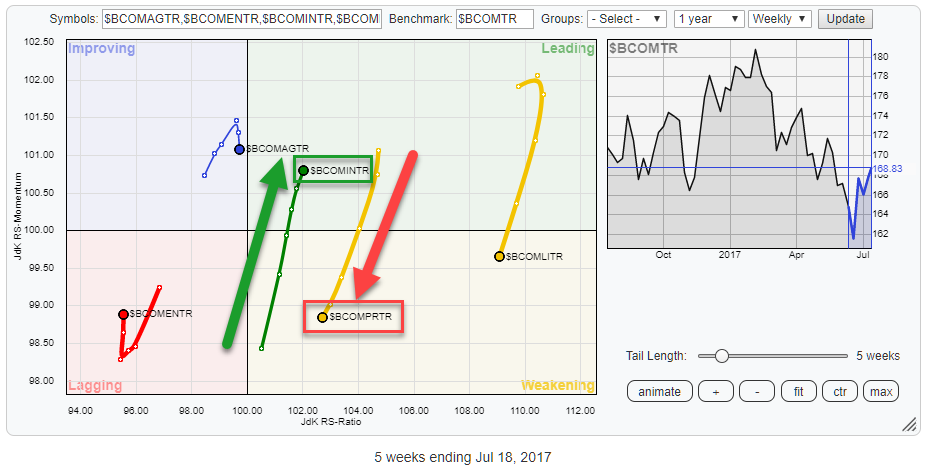
 The above Relative Rotation Graph holds the main commodity groups (BCOM family) and uses the Bloomberg Commodity Index as the benchmark.
The opposite directions in the rotations of Industrial metals ($BCOMINTR) and Precious metals ($BCOMPRTR) stand out for me.
As they are both on the right-hand side of the graph we can conclude that the relative trend against $BCOMTR is positive. If you open up the live version of the chart and scroll through time you can see that Industrial metals rotated through weakening and have just turned up and crossed back into the leading quadrant. This is usually a strong rotation with a positive follow through.
Precious metals are coming straight down from the leading quadrant and are starting to move lower on the JdK RS-Ratio scale as well.
The similar length of the tails indicates that both moves have more or less equal power behind them.
This observation on the Relative Rotation Graph leads to the chart you should not ignore!
Industrial Metals vs Precious metals
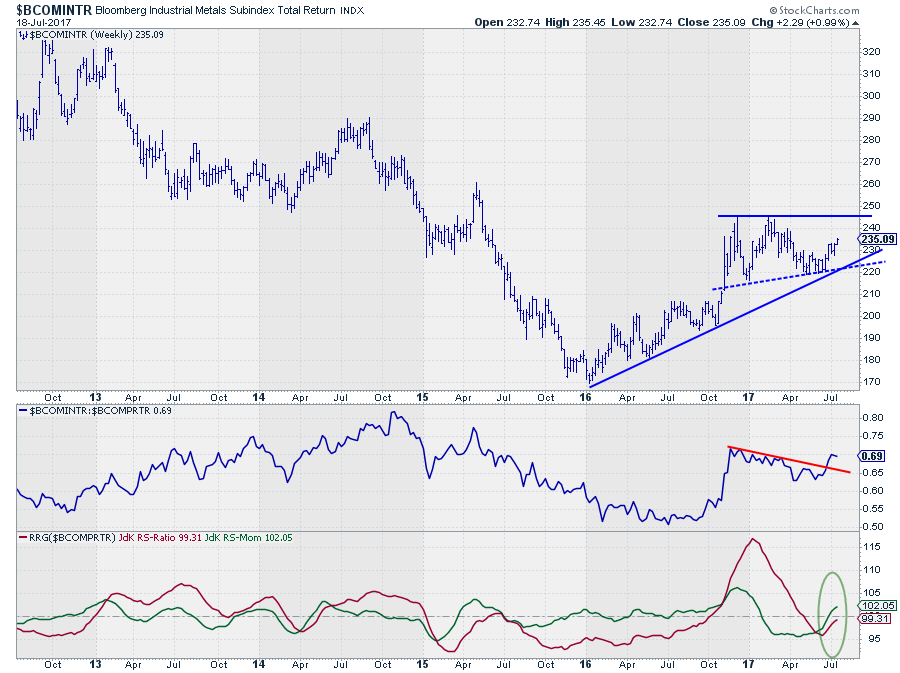 After an improvement of relative strength versus precious metals in the second half of 2016, precious metals took the lead in the first half of this year (a declining relative strength line means precious metals are doing better than industrials).
This downtrend has changed recently when the RS-line broke above its falling resistance line. This move is being picked up by the RRG-Lines now. JdK RS-Momentum is already above 100 while JdK RS-Ratio is close to crossing over.
On the price chart, Industrial metals have enough room to move higher before the next resistance level around $ 245 is reached. A break beyond this barrier will very likely trigger even more upside potential.
All in all, it looks as if Industrial metals, at the moment, hold more value than the precious ones!
Julius de Kempenaer | RRG Research
RRG, Relative Rotation Graphs, JdK RS-Ratio, and JdK RS-Momentum are registered TradeMarks by RRG Research
Follow RRG Research on social media:
If you want to discuss RRG with me on SCAN, please use my handle Julius_RRG so I will get a notification


