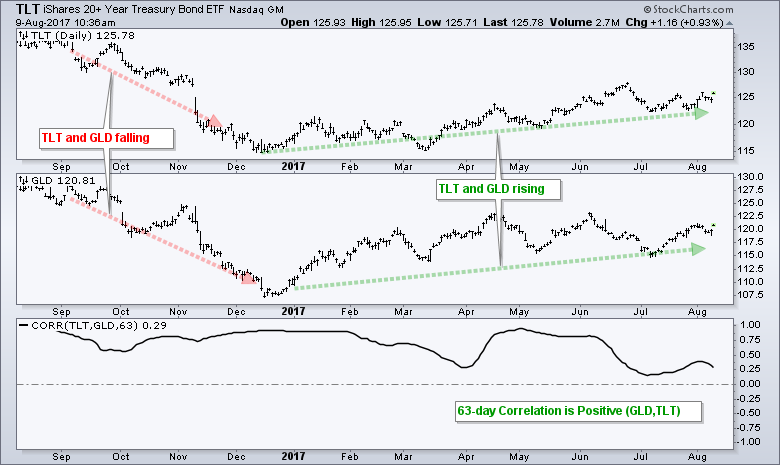
The Gold SPDR (GLD) and the 20+ YR T-Bond ETF (TLT) are both having good years with GLD up around 10% year-to-date and TLT up around 7%. As the chart below shows, these two are positively correlated over the past 12 months. The indicator window shows the 63-day Correlation Coefficient (TLT, GLD) in positive territory for the entire chart. 63 days is around three months or a quarter. Chartists looking for more sensitivity may try a 20-day Correlation Coefficient. This positive relationship is visible today with both up sharply in early trading. In addition to the greenback, chartists looking for clues on gold should also watch the bond market.
****************************************
Thanks for tuning in and have a great day!
--Arthur Hill CMT
Plan your Trade and Trade your Plan
****************************************


