The long-term trend for Applied Materials (AMAT), a big semiconductor equipment manufacturer, is clearly up and the short-term trend could be turning up again with a gap three days ago. The chart below shows AMAT hitting a 52-week high in early June and then forming a large triangle. This is basically a large consolidation within an uptrend, which means it is a bullish continuation pattern. A move above 48 would break triangle resistance, but this level is still quite far away.
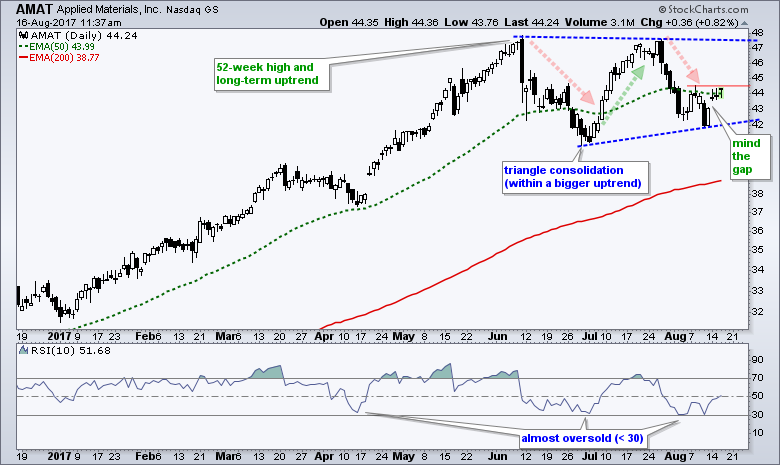
The action within the triangle is what caught my interest. The arrows show three swings within this triangle (down, up, down). The current swing is down, but could be reversing with the gap on Monday. The red line marks resistance from last week's high and this is the first level to beat. The indicator window shows 10-day RSI almost becoming oversold this month for the third time since April.
Follow me on Twitter @arthurhill - Keep up with my 140 character commentaries.
****************************************
Thanks for tuning in and have a good day!
--Arthur Hill CMT
Plan your Trade and Trade your Plan
*****************************************


