Texas Instruments (TXN), the semiconductor behemoth, formed a bullish cup-with-handle pattern and a classic volume-based indicator points to a breakout. The chart shows TXN hitting resistance in the 83-84 area from June to September (red zone). In between these resistance points, the stock dipped to the 76 area in June and then the 80 area in August. The June dip forms the bowl, while the August consolidation forms the handle (blue lines). A break above rim resistance would signal a continuation of the long-term uptrend and forge new highs.
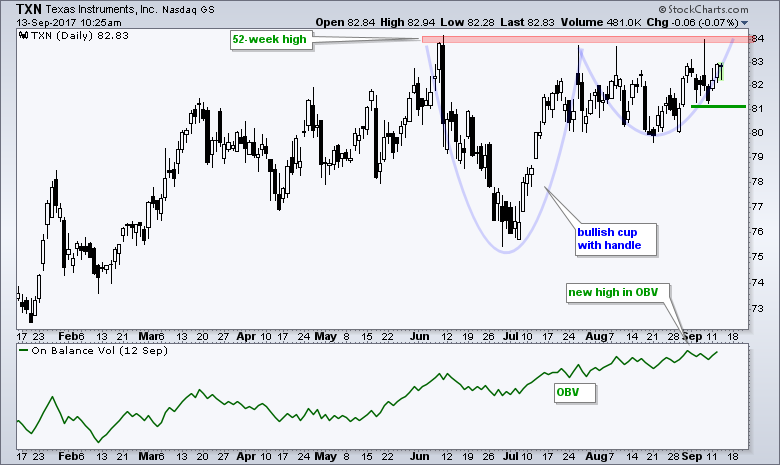
The indicator window shows On Balance Volume (OBV) hitting a new high in early September. Joe Granville theorized that volume leads price and the new high in OBV points to a breakout in the stock. Volume is, however, just an indicator. Price action is what really counts so remain focused on the price chart. A close below 81 would argue for a reassessment of this bullish pattern.
Follow me on Twitter @arthurhill - Keep up with my 140 character commentaries.
****************************************
Thanks for tuning in and have a good day!
--Arthur Hill CMT
Plan your Trade and Trade your Plan
*****************************************


