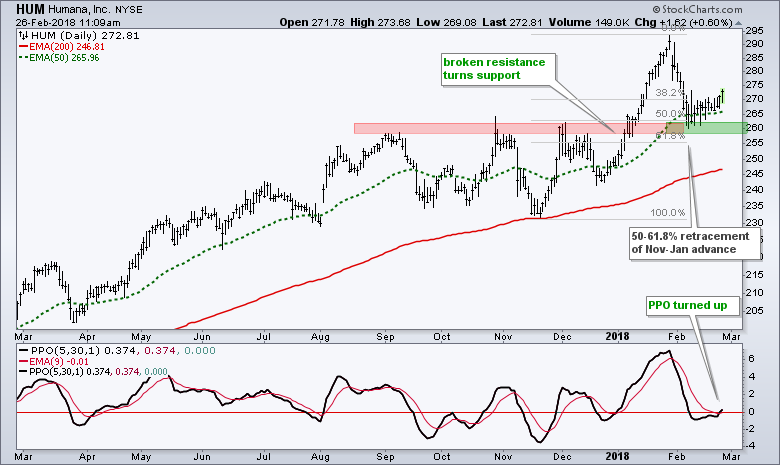
 Humana (HUM) is part of the HealthCare Providers ETF (IHF) and this group led the market from mid-October to late January with a 20+ percent surge to new highs. The group pulled back in February, but the long-term trend is up and this bodes well for stocks in the group.
First and foremost, all indications point to a long-term uptrend. HUM broke a major resistance zone in January and hit a series of new highs that month. Second the 50-day EMA (green) is above the 200-day EMA (red) and HUM is above the rising 200-day EMA.
The stock fell back to the breakout zone in early February and firmed in the 265 area. A classic tenet of technical analysis is that broken support turns resistance and this level is proving itself so far.
In addition to support in the 260 area, notice that the February decline retraced 50-61.8% of the prior advance. This is a normal retracement for a correction after a big move.
Signs of an upturn are emerging as the stock moved higher the last three days and the PPO (5,30,5) turned up. Notice that the PPO broke its signal line and moved into positive territory. I would treat this upturn as bullish as long as the PPO stays positive and Humana holds above 265.
Plan Your Trade and Trade Your Plan.
- Arthur Hill, CMT
Senior Technical Analyst, StockCharts.com
Book: Define the Trend and Trade the Trend
Twitter: Follow @ArthurHill

